Update April, 2023
- A primer on air pollution monitoring (2023)
- The primer is also available in other languages [Hindi] [Chinese] [Russian]
- A primer on know your air pollutants (2023)
March 12th, 2018:
During a question and answer session in Delhi (in December, 2017), I was asked this question “Since Diwali, Delhi government installed 20 continuous monitoring stations. Despite this bump in the monitoring efforts (from 6 to 20 monitors), why are the pollution levels still so high?”.
A simple answer to this is that monitoring is a diagnostic tool to assess levels of air pollution and in and off itself monitoring does not reduce any air pollution.
What it does do, is provide a starting point for understanding the air pollution problem (spatially and temporally) and provides a direction for addressing pollution control options.
This got me thinking.
Having worked on air pollution related research for my entire career, I have to constantly remind myself of a cognitive bias while communicating on matters related to air pollution. This means that I (unknowingly) assume that others also understand the concepts related to air pollution (and monitoring) as I understand them. This type of bias tends to be reinforced when speaking to other “experts” and the only way to break out of this bias is to communicate as clearly as possible.
There are several topics within air pollution that I would like to speak about – such as source apportionment, dispersion modelling, emissions inventory, etc. In this blog, I will try to explain the concept of “air quality monitoring”, what it means, how it is done, what do we get out of it, and how the data can be used, with some illustrations along the way. All the examples and illustrations in this blog are from India, but these are common practices everywhere.
+ What is air pollution monitoring?
Monitoring is an exercise to measure ambient air pollution levels in an area.
The data will indicate the status of the quality of air we breathe.
The data, over a long term, allows us to tease out patterns that help support air pollution control policy. These patterns include, spatial differences in pollution (which areas of the city are more polluted or better) and temporal differences (is there a pattern of pollution levels during the day and/or over the seasons).
So, while air pollution monitoring itself does not reduce air pollution, it gives us clues on how much is the pollution, where is the pollution, and when is that pollution.
Using these data trends, we can conclude if our efforts for improving the quality of air are successful and by how much. If not, do we need to try other options or be more aggressive in our current efforts.
+ Why do we assume that monitoring pollution will lead to better air quality?
 Air pollution monitoring informs air pollution policy and because of this connection, monitoring activities are often cited as an integral part (if not the key measure) of a pollution control strategy by policy makers, and by extension, the media.
For example, here is an article from 2016 in the Hindustan Times that quotes, “The mobile air quality monitoring unit will be capable of real-time sampling, analysis and control of air pollution from sources..”
To a non-technical reader, this statement means that while the mobile air pollution monitoring unit is making rounds in the city, it is also controlling air pollution.
+ How does one monitor ambient air pollution?
Monitoring is a generic term used for methods to assess the level of air pollution. For air pollution measurements, ambient is all the air under 10m (roughly); at which point the vertical mixing is homogeneous and representative of all the sources in the vicinity (including pollution coming from long distance – neighboring village, city, state, or even country).
There are several types of monitoring (ambient static, ambient mobile, and stack emissions), different ways of collecting this information (reference grade systems and low cost sensors), and multiple uses of this information (trends, exposure assessments, and source apportionment).
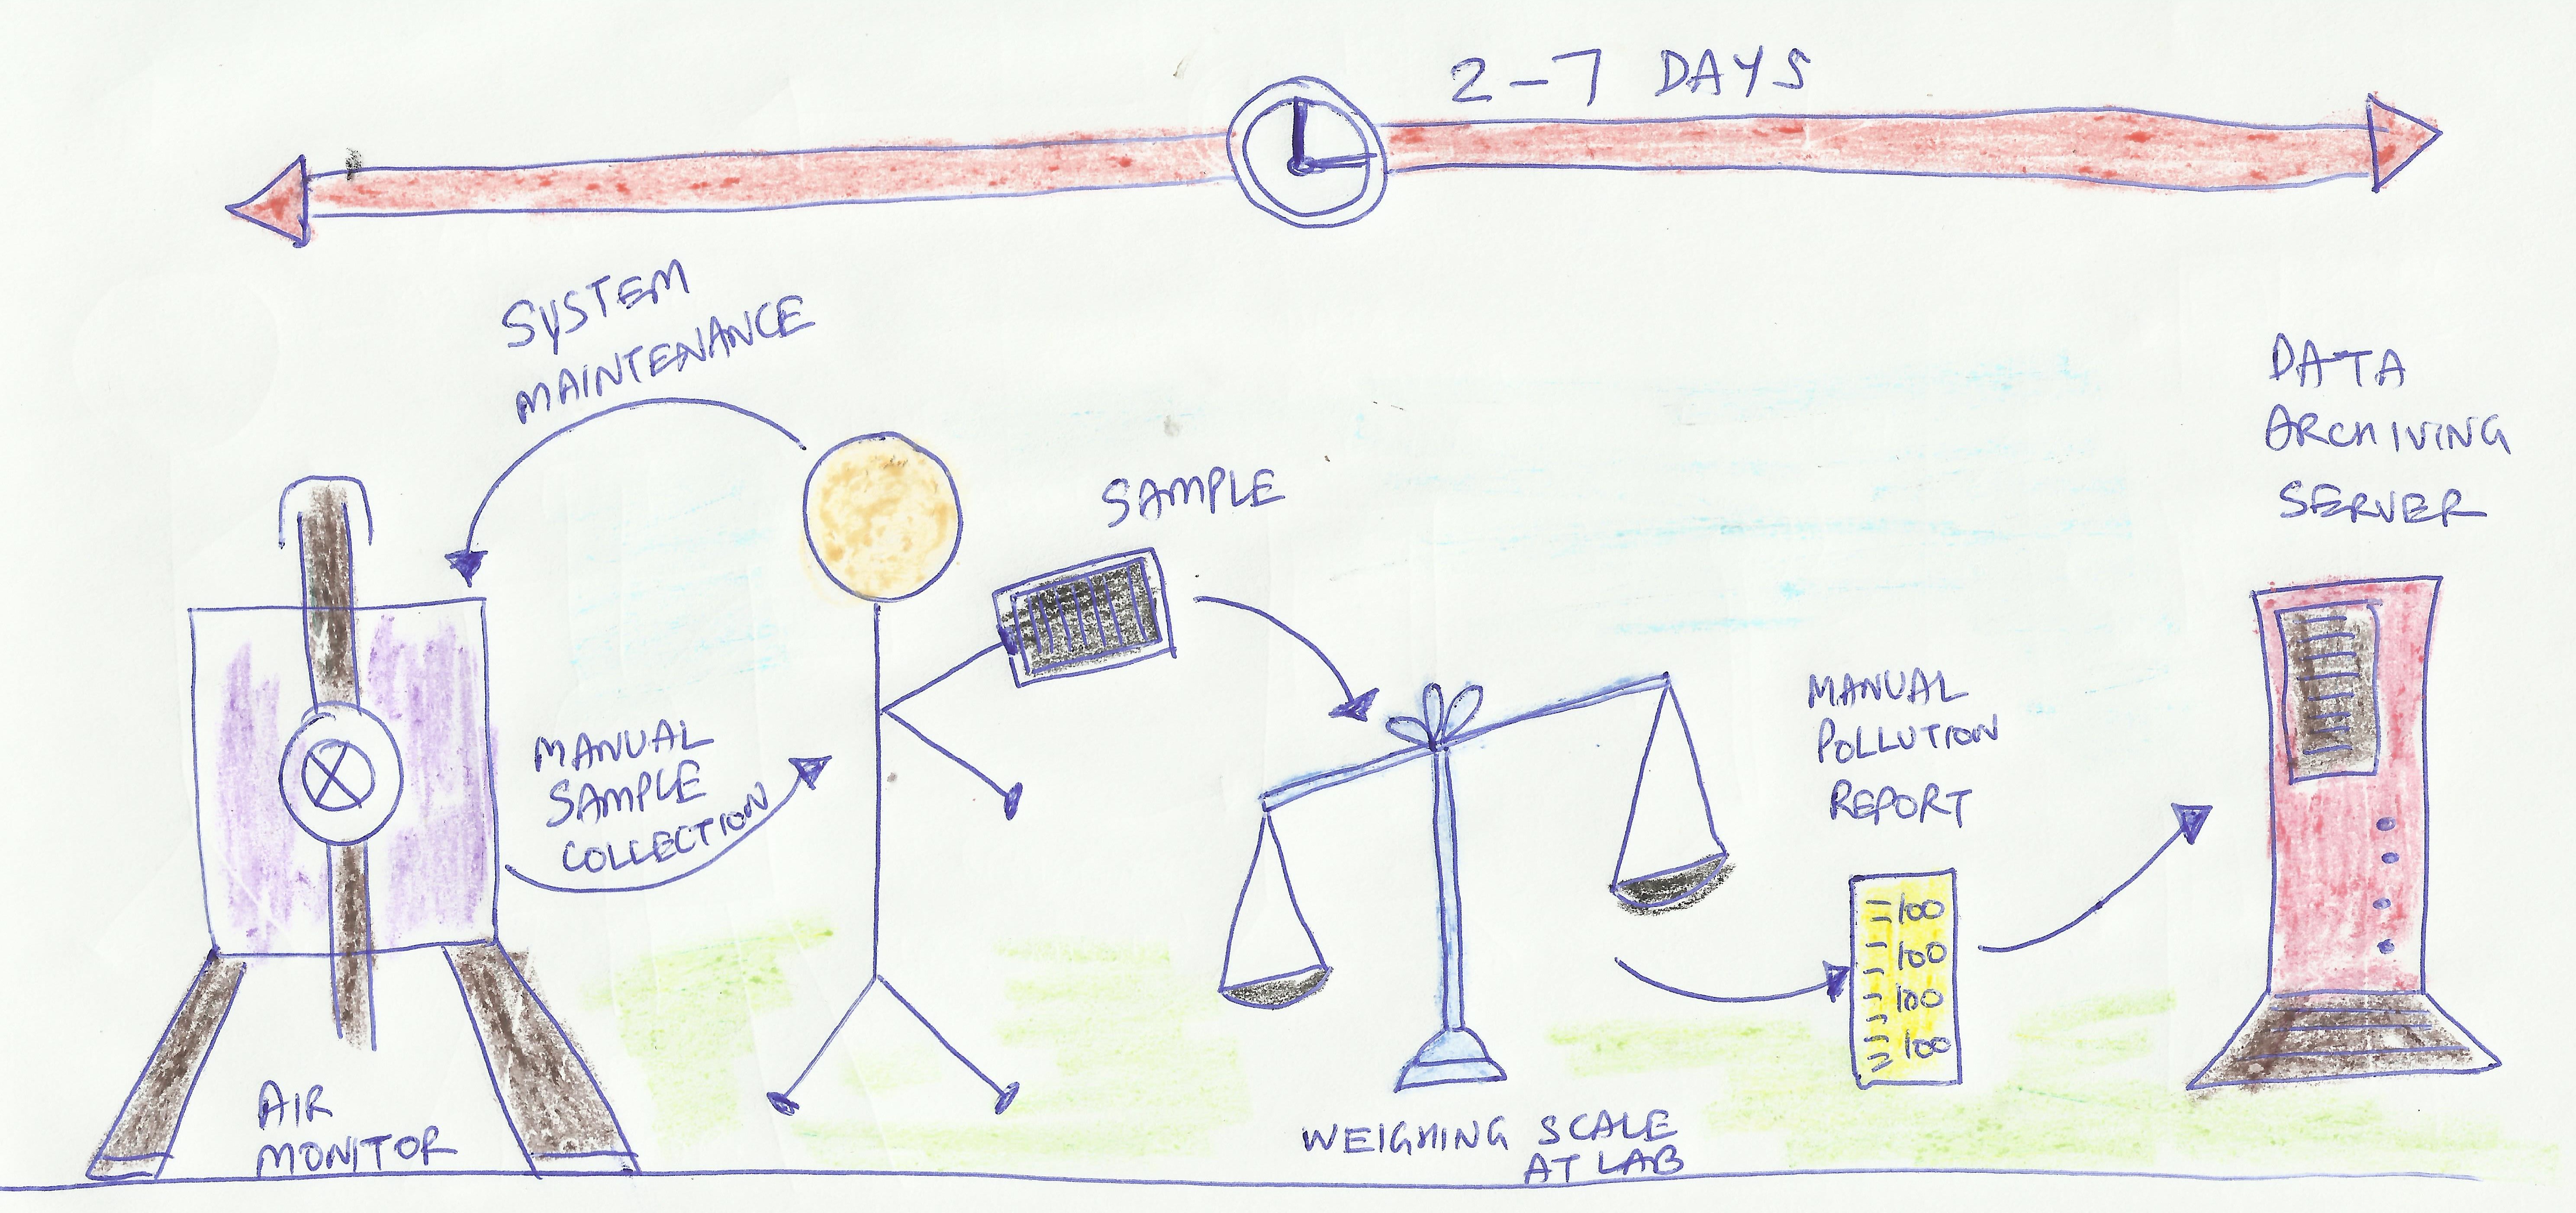
+ What is manual air pollution monitoring?
This is a process in which a physical sample is collected, which is then weighed in the lab, analyzed, recorded, and then posted for consumption.
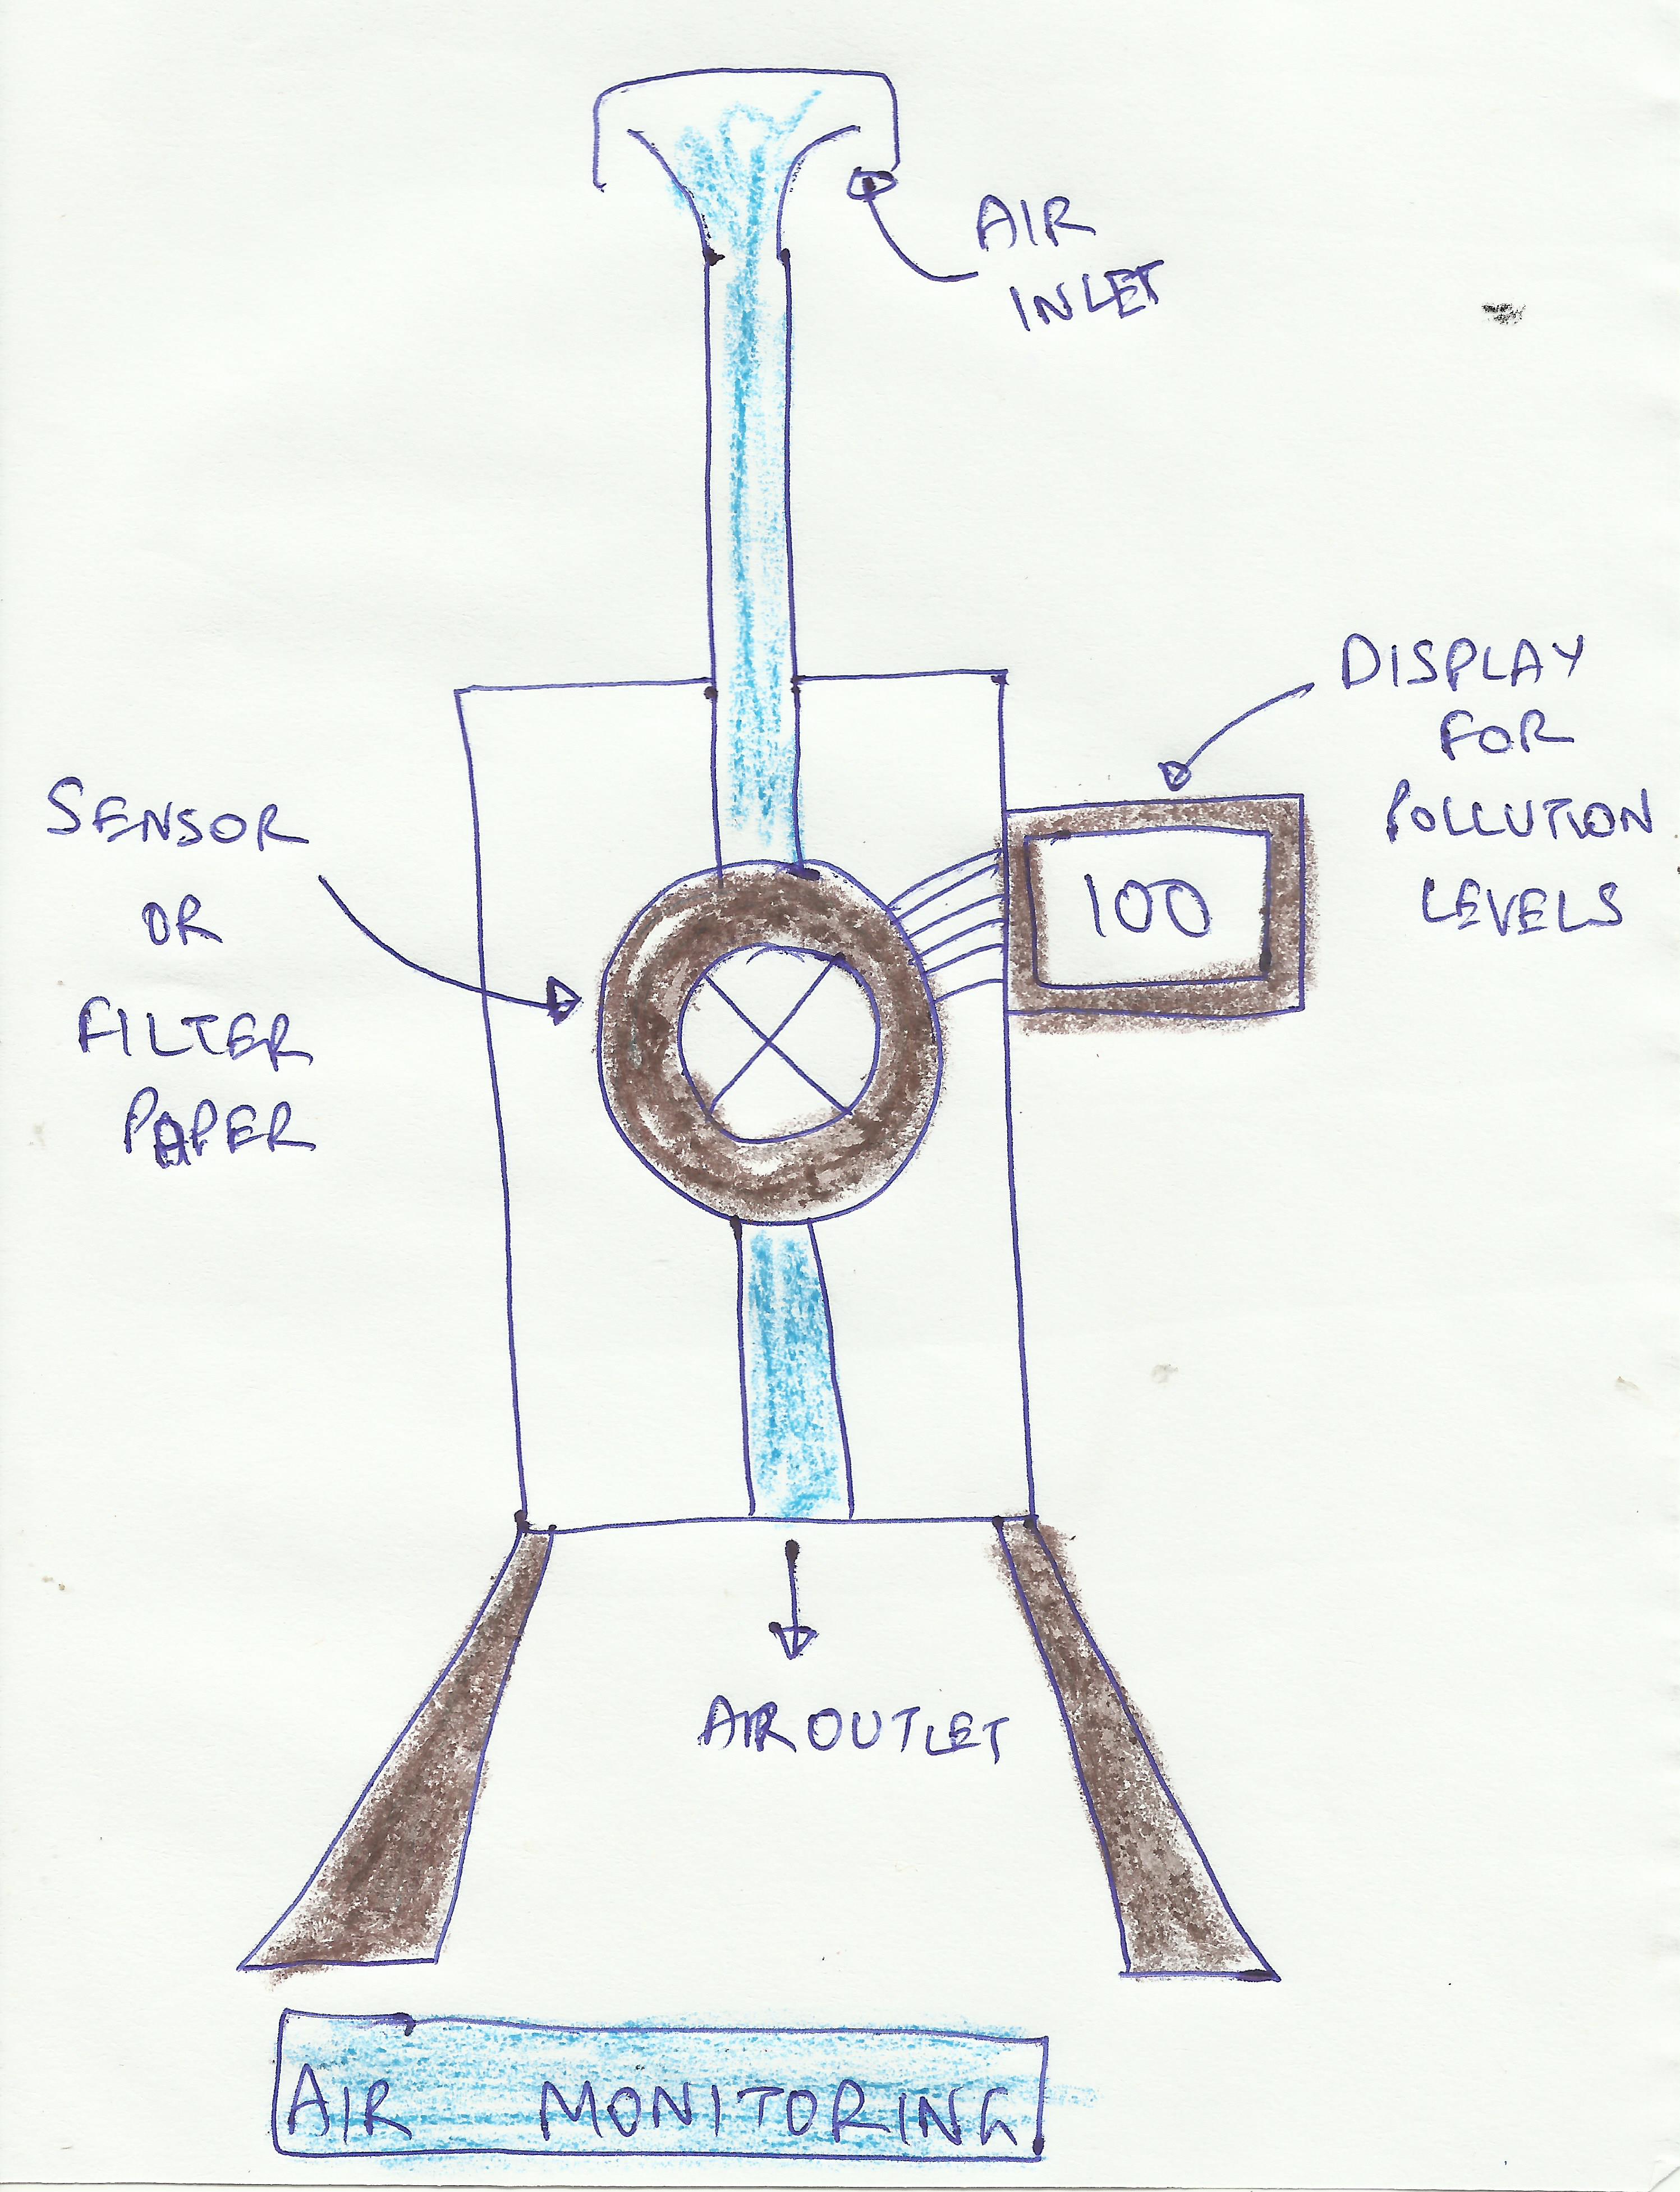
+ What is continuous air pollution monitoring?
This is a process in which except for periodically taking care of the monitoring equipment, all the steps (sampling, weighing, analyzing, recording, and posting of the data) are automated.

+ What is the height at which ambient measurements are conducted?
Referring to the ambient monitoring protocols proposed by the Central Pollution Control Board (CPCB, New Delhi, India), a station is to be located 3-10m from the ground and not at “ground zero”. This represents all source contributions at that point and not be biased by a source (at ground zero e.g., vehicle exhaust) that can influence the monitoring results – in this case, overestimation of the pollution levels due to direct vehicle exhaust emissions.
+ How to select measurement sites?
The location of the measurement sites is very crucial and can lead to biases in the final results – a site close to the industrial estate, or a site in the middle of the residential area, or a site obstructed by surrounding trees, or a site close to the traffic junction, or a site in the middle of a park.
A general understanding is that an ambient monitoring station can represent an area covering 2 km radius, which translates to 15 sq.km (rounded off). If the city size is 1,000 sq.km, then you need 67 stations spread across the city. In addition, we must also consider population density, the range of industrial activities, and local landuse, which will further determine the required number of stations. This is an ideal requirement with enough funding. To minimize these biases, proper protocol for installing monitoring stations is that there are multiple monitors at different sites, representing all areas and activities in the city.

If long-term planning is the goal, then the ambient stations must run constantly (with proper maintenance, calibration of machines, and quality control checks), so that the resulting data can provide a representative picture of spatial trends of pollution in a cities airshed, as well as provide diurnal (within the day) and seasonal (within the year) trends in air pollution levels.
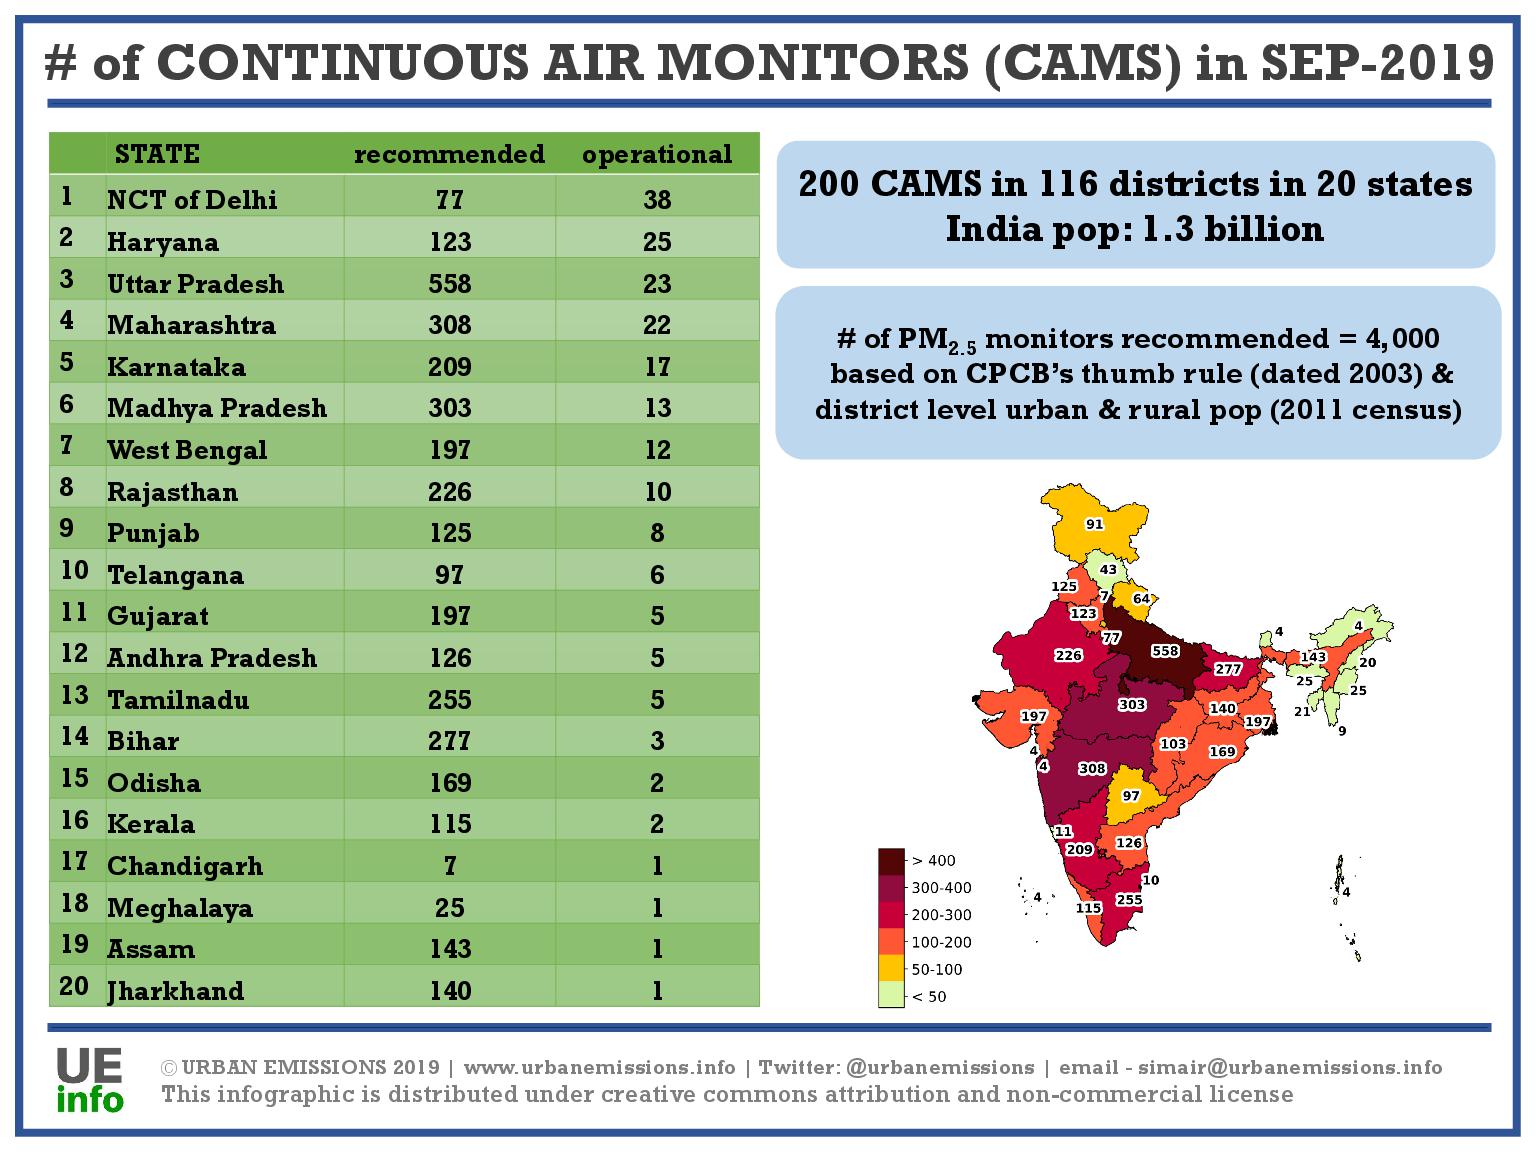
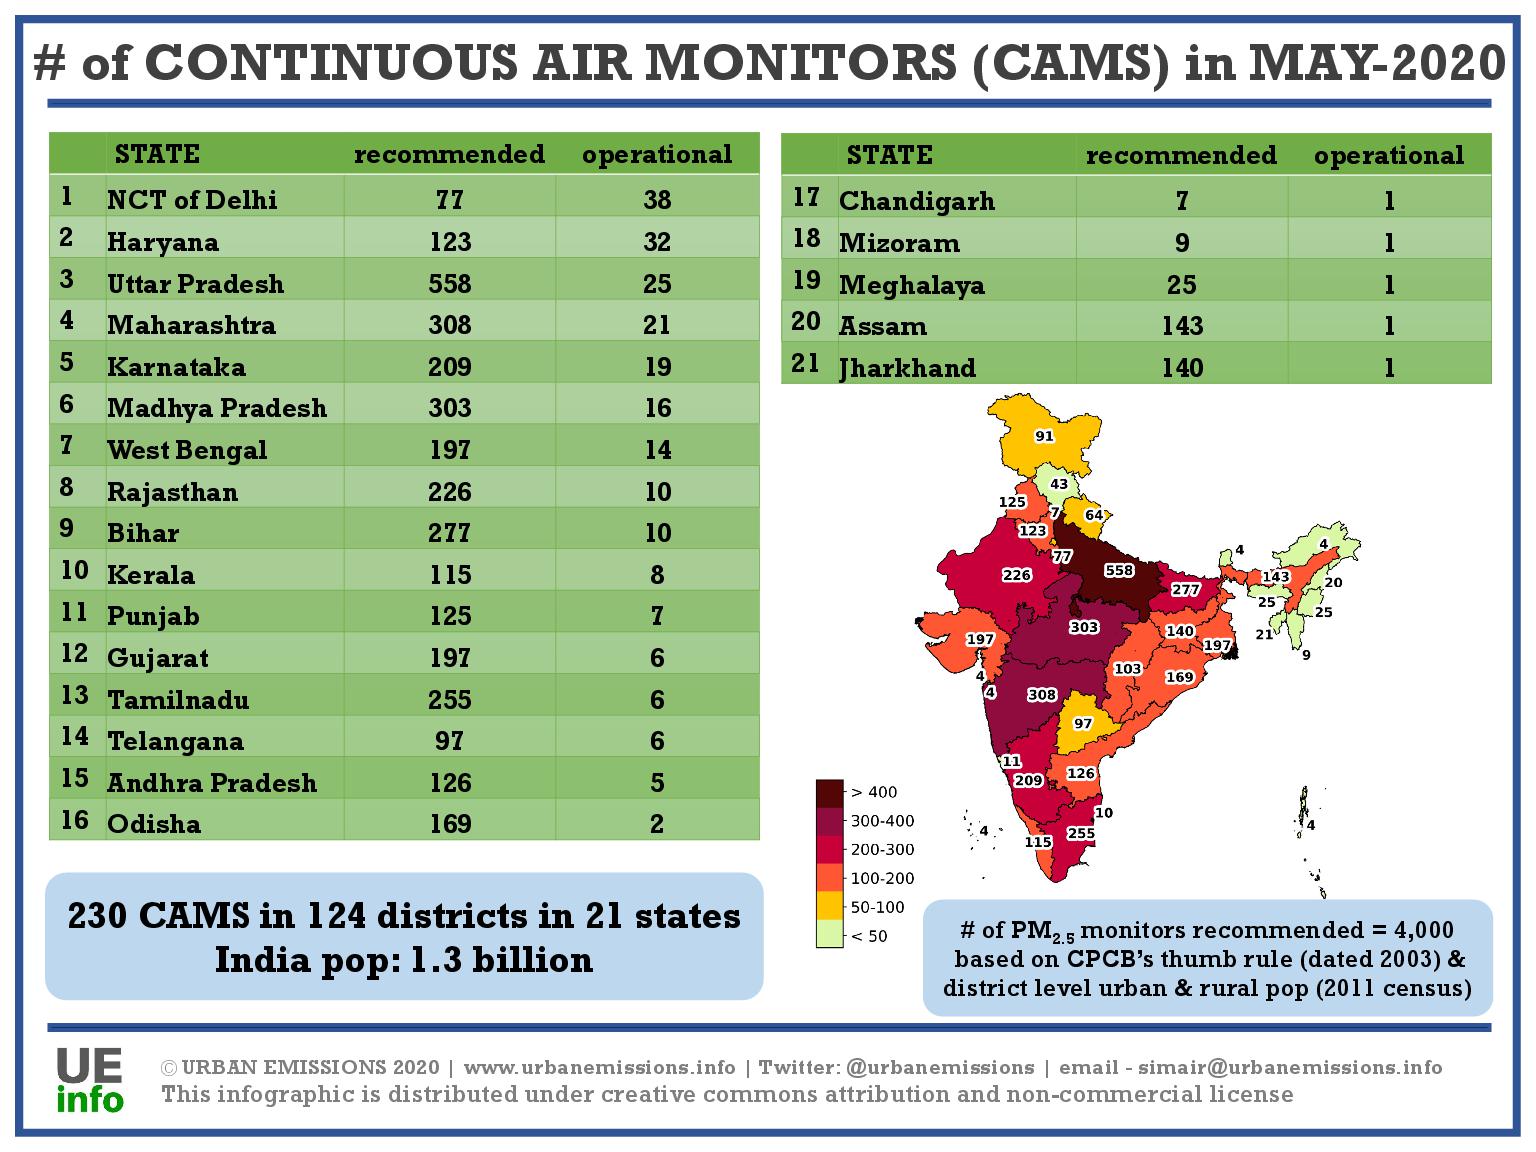
+ How many continuous monitoring stations are required for India?
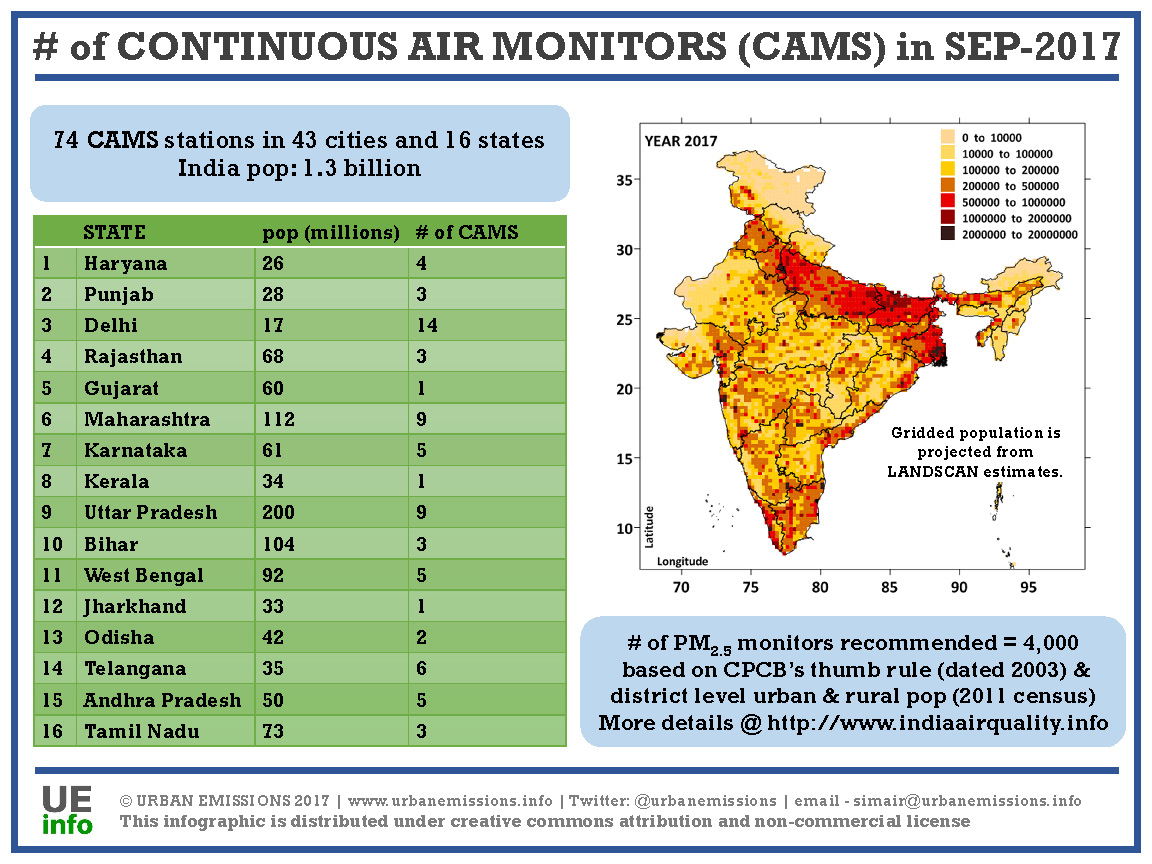
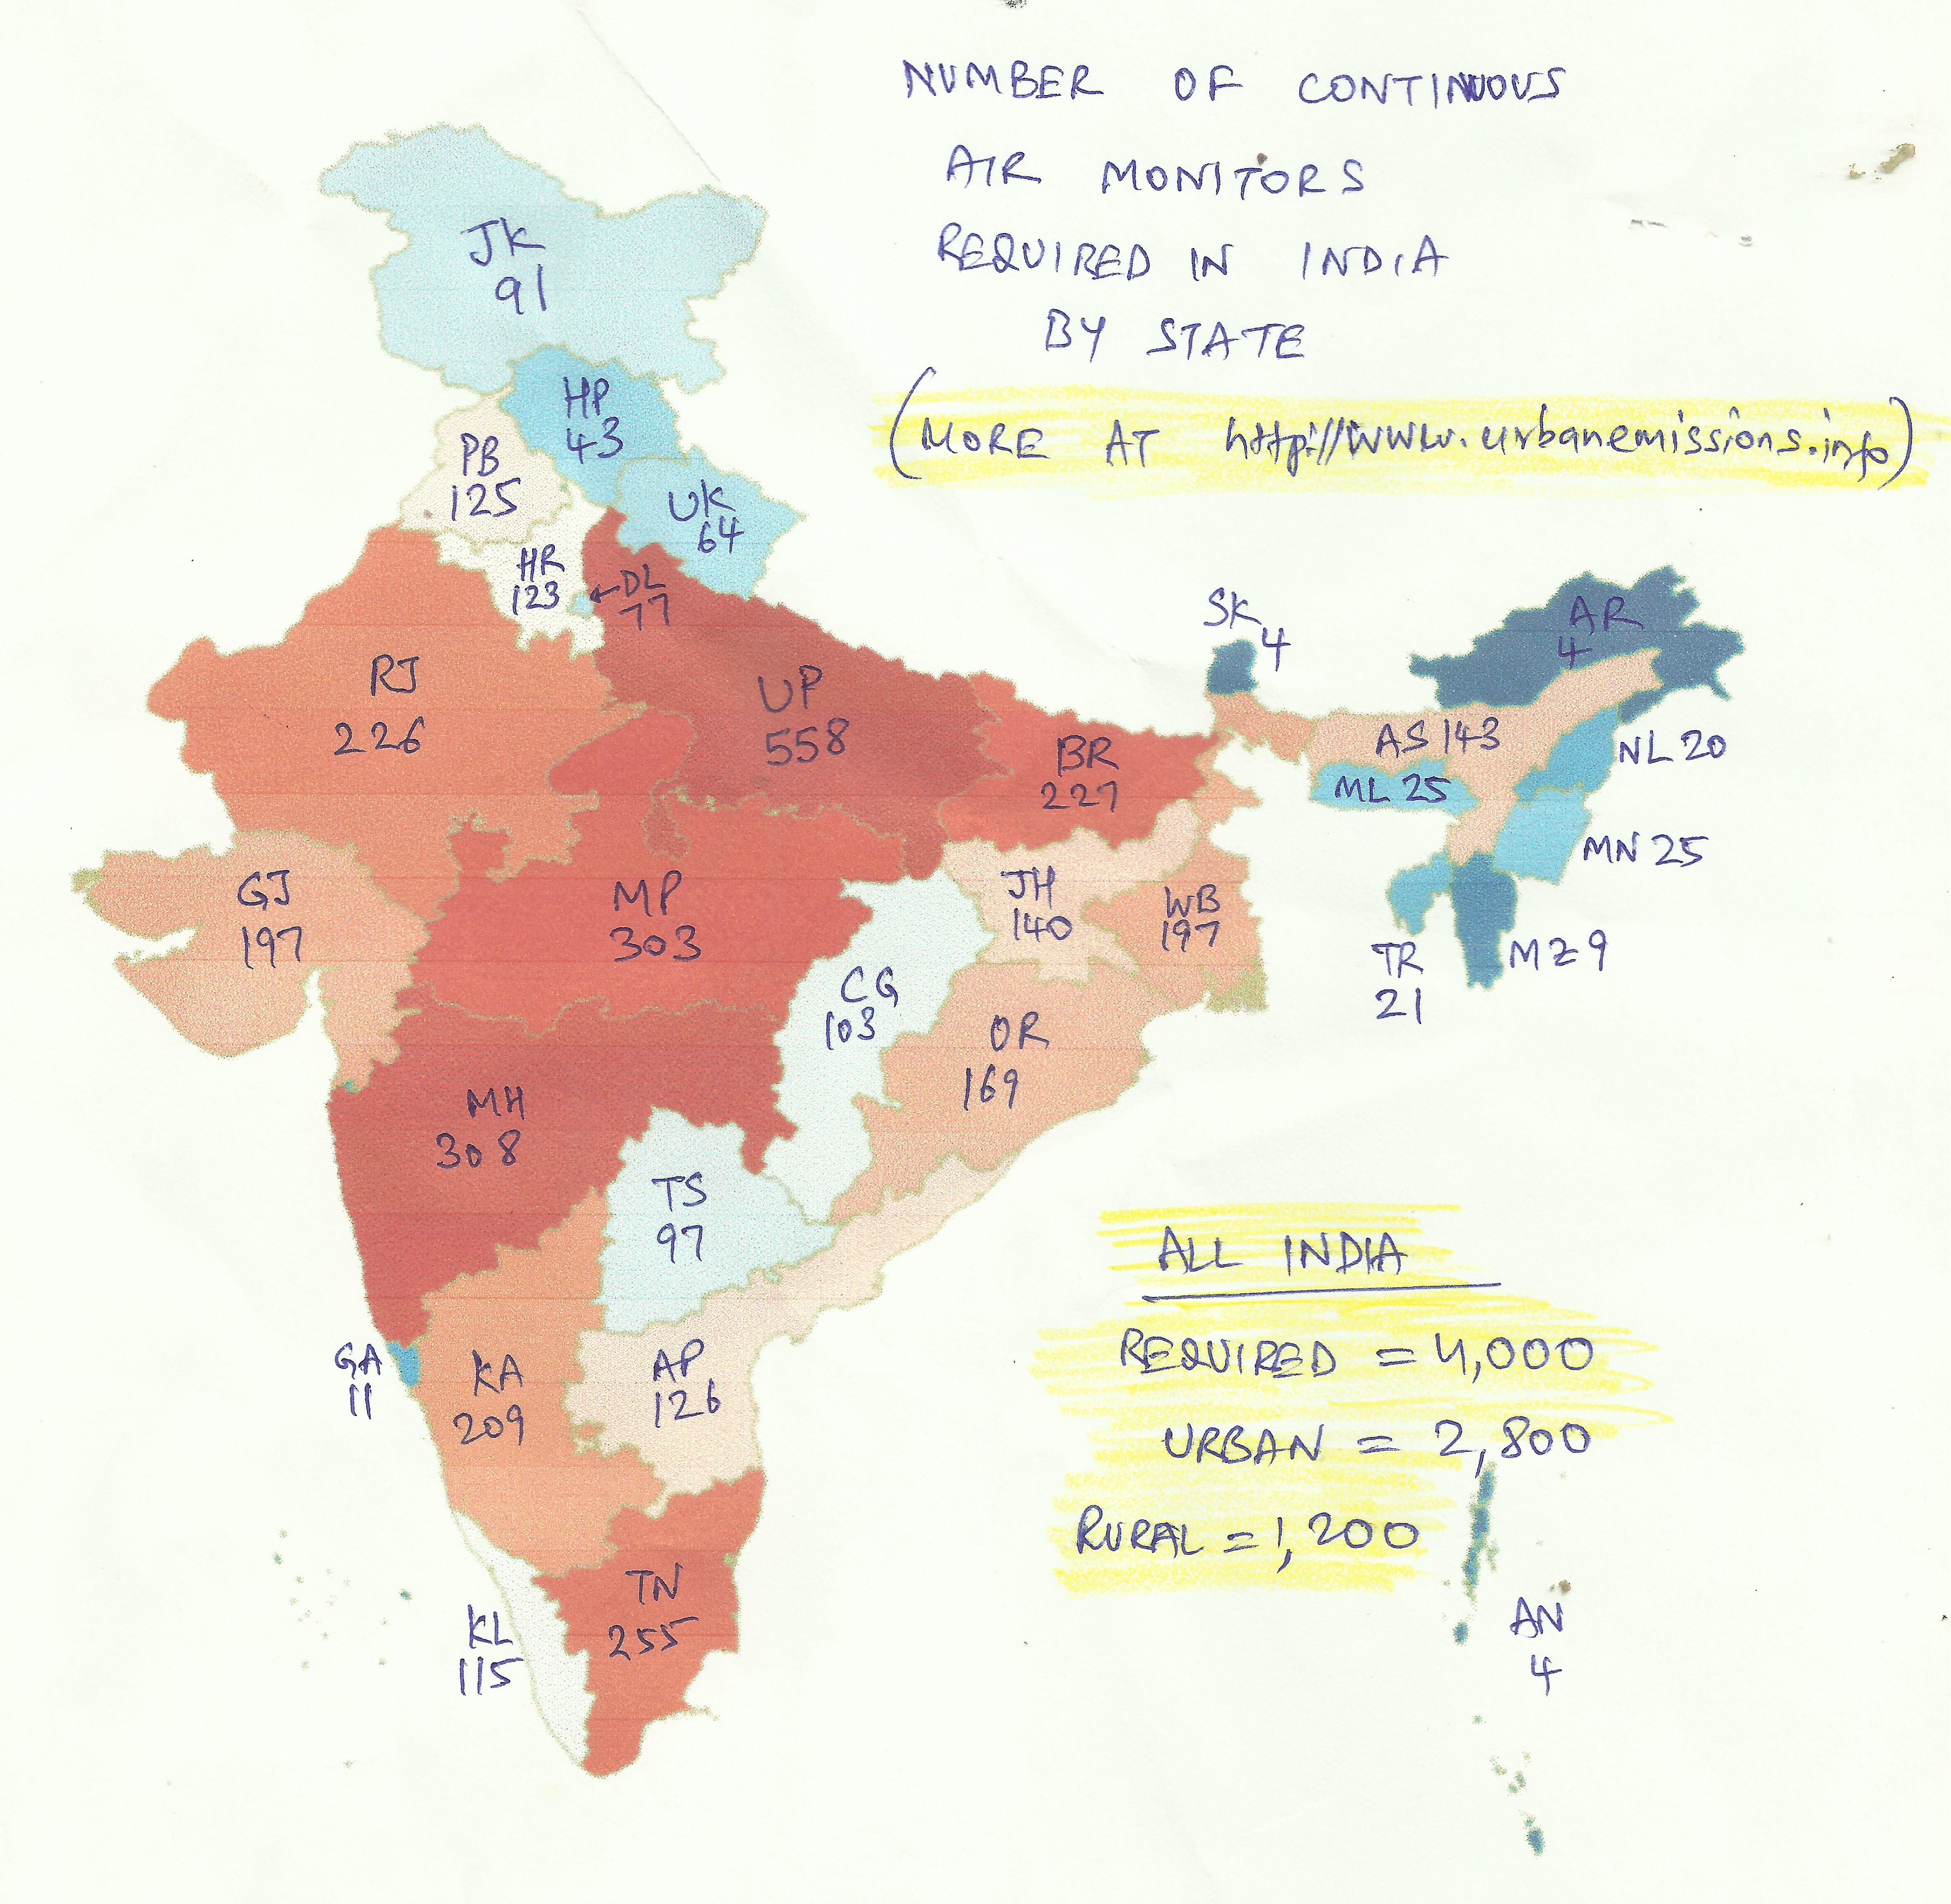 Using a thumb rule created by Central Pollution Control Board (CPCB, India), which considers the total population of the district and the mix of activities, we estimate a need for 4,000 stations in India – 2,800 in the urban areas and 1,200 in the rural areas. Details on the number of ambient monitors required and the number of ambient monitors operational, by state and by district are available here.
For example, Uttar Pradesh with a population of over 200 million requires 558 stations and Delhi with a population of over 20 million requires 77.
 |
 |
 |
+ What is mobile air pollution monitoring?
When this term is used, especially by pollution control boards (PCBs), this is referring to a van equipped with the same instruments as a regulatory-grade ambient monitoring station, which when needed, is taken out, parked at the site under audit, and run for a day or a week or more, to collect ambient monitoring data for all the criteria pollutants. The flexibility of the station to relocate between sites is what makes it mobile, but the measurements taken from the unit are considered ambient, since the unit stays put, at a pre-selected spot, to take long-term measurements.
+ What is on-road air pollution monitoring?
Often in the literature, words like “on-road” and “mobile” are used interchangeably, referring to the fact that the measurements are conducted when the instruments are in motion. In this case, all the instruments are strapped inside (or on) the vehicle and driven to measure on-road air pollution levels.
If this exercise is repeated for long periods and in multiple modes (cars, buses, cycle, motorcycle, and walking), we can establish a heat map of pollution on the roads. It is very important to note that measurements collected from this exercise are biased towards sources on the road and one land use (roads) in the city, which by design cannot be compared to the data from the ambient monitoring stations or to the ambient standards. However, this exercise is complementary, which can help create a better understanding of how much pollution travelers are exposed to.
 The above graph presents a summary of exposure rates while traveling in various modes in Delhi (this study was conducted by the staff and the students at TRIPP center, Indian Institute of Technology, New Delhi, India). In simple terms, one could build a health exposure function for the urban travelers – if the city’s daily average ambient pollution is 100 μg/m3, the traveler on the roads is exposed to 20-30% more pollution (on average per day). This comparison makes sense only between averages of ambient and averages of on-road measurements.
Another example, below is a 2-min video from an on-road exposure study, presenting the highs (and lows) of PM2.5 pollution, that a traveler in an auto-rickshaw is exposed to in Delhi (click here more details on the study). You will notice that the instrument records highs of 3000 μg/m3, but these are instantaneous values that the traveler is exposed to, for 1-2 seconds, which cannot be compared to ambient monitoring data averages. This study estimated that on average a traveler in an auto-rickshaw is exposed to 50% more pollution on the roads, compared to average ambient PM2.5 levels in Delhi.
+ How to use satellite observations to infer air quality?
Raw data from satellite retrievals is columnar – representing everything from the lens of the satelite to the ground. Converting this value to ground concentrations is a multiple step procedure that involves estimating pollution levels using a modelling exercise based on multiple assumptions. The assumptions include on-ground measurements from ambient air monitoring stations, and results of a global chemical transport model to under the vertical distribution of the pollution. These models also depend on estimated emission inventories to drive the chemical transport model. Hence for accurate estimates from satellite monitoring, data from on-ground monitoring stations and emission inventories is crucial.
 For example, NASA MODIS satellite, is the most commonly used data feed for aerosol optical depth assessments that is used to estimate global PM2.5 concentrations. This satellite orbits at 705 km and takes 99 minutes in the polar orbit to go around the earth. A newer model is ESA Sentinel series, which orbits at 693 km. In short, we have snapshots (when the image is cloud free) of aerosol optical depth, over India, taken in a matter of seconds, to determine what the pollution levels are for that day. These snapshots tell a fascinating story, but not enough to understand the true diurnal and seasonal cycles of the on-ground pollution levels in India.
Dissecting satellite feeds, linking them to modeled data, and regressing it to on-ground concentrations, is a lengthy exercise and only a handful of groups have the technical capacity to use this methodology. Given the efforts in place to increase the ambient monitoring stations in India and the new satellites to focus on air pollutants over India (in the geostationary orbits), this methodology will get better. But today, if there is money to spend to understand air pollution in the urban and in the rural areas of India, then these efforts should be on the ground to strengthen the ambient monitoring data pool
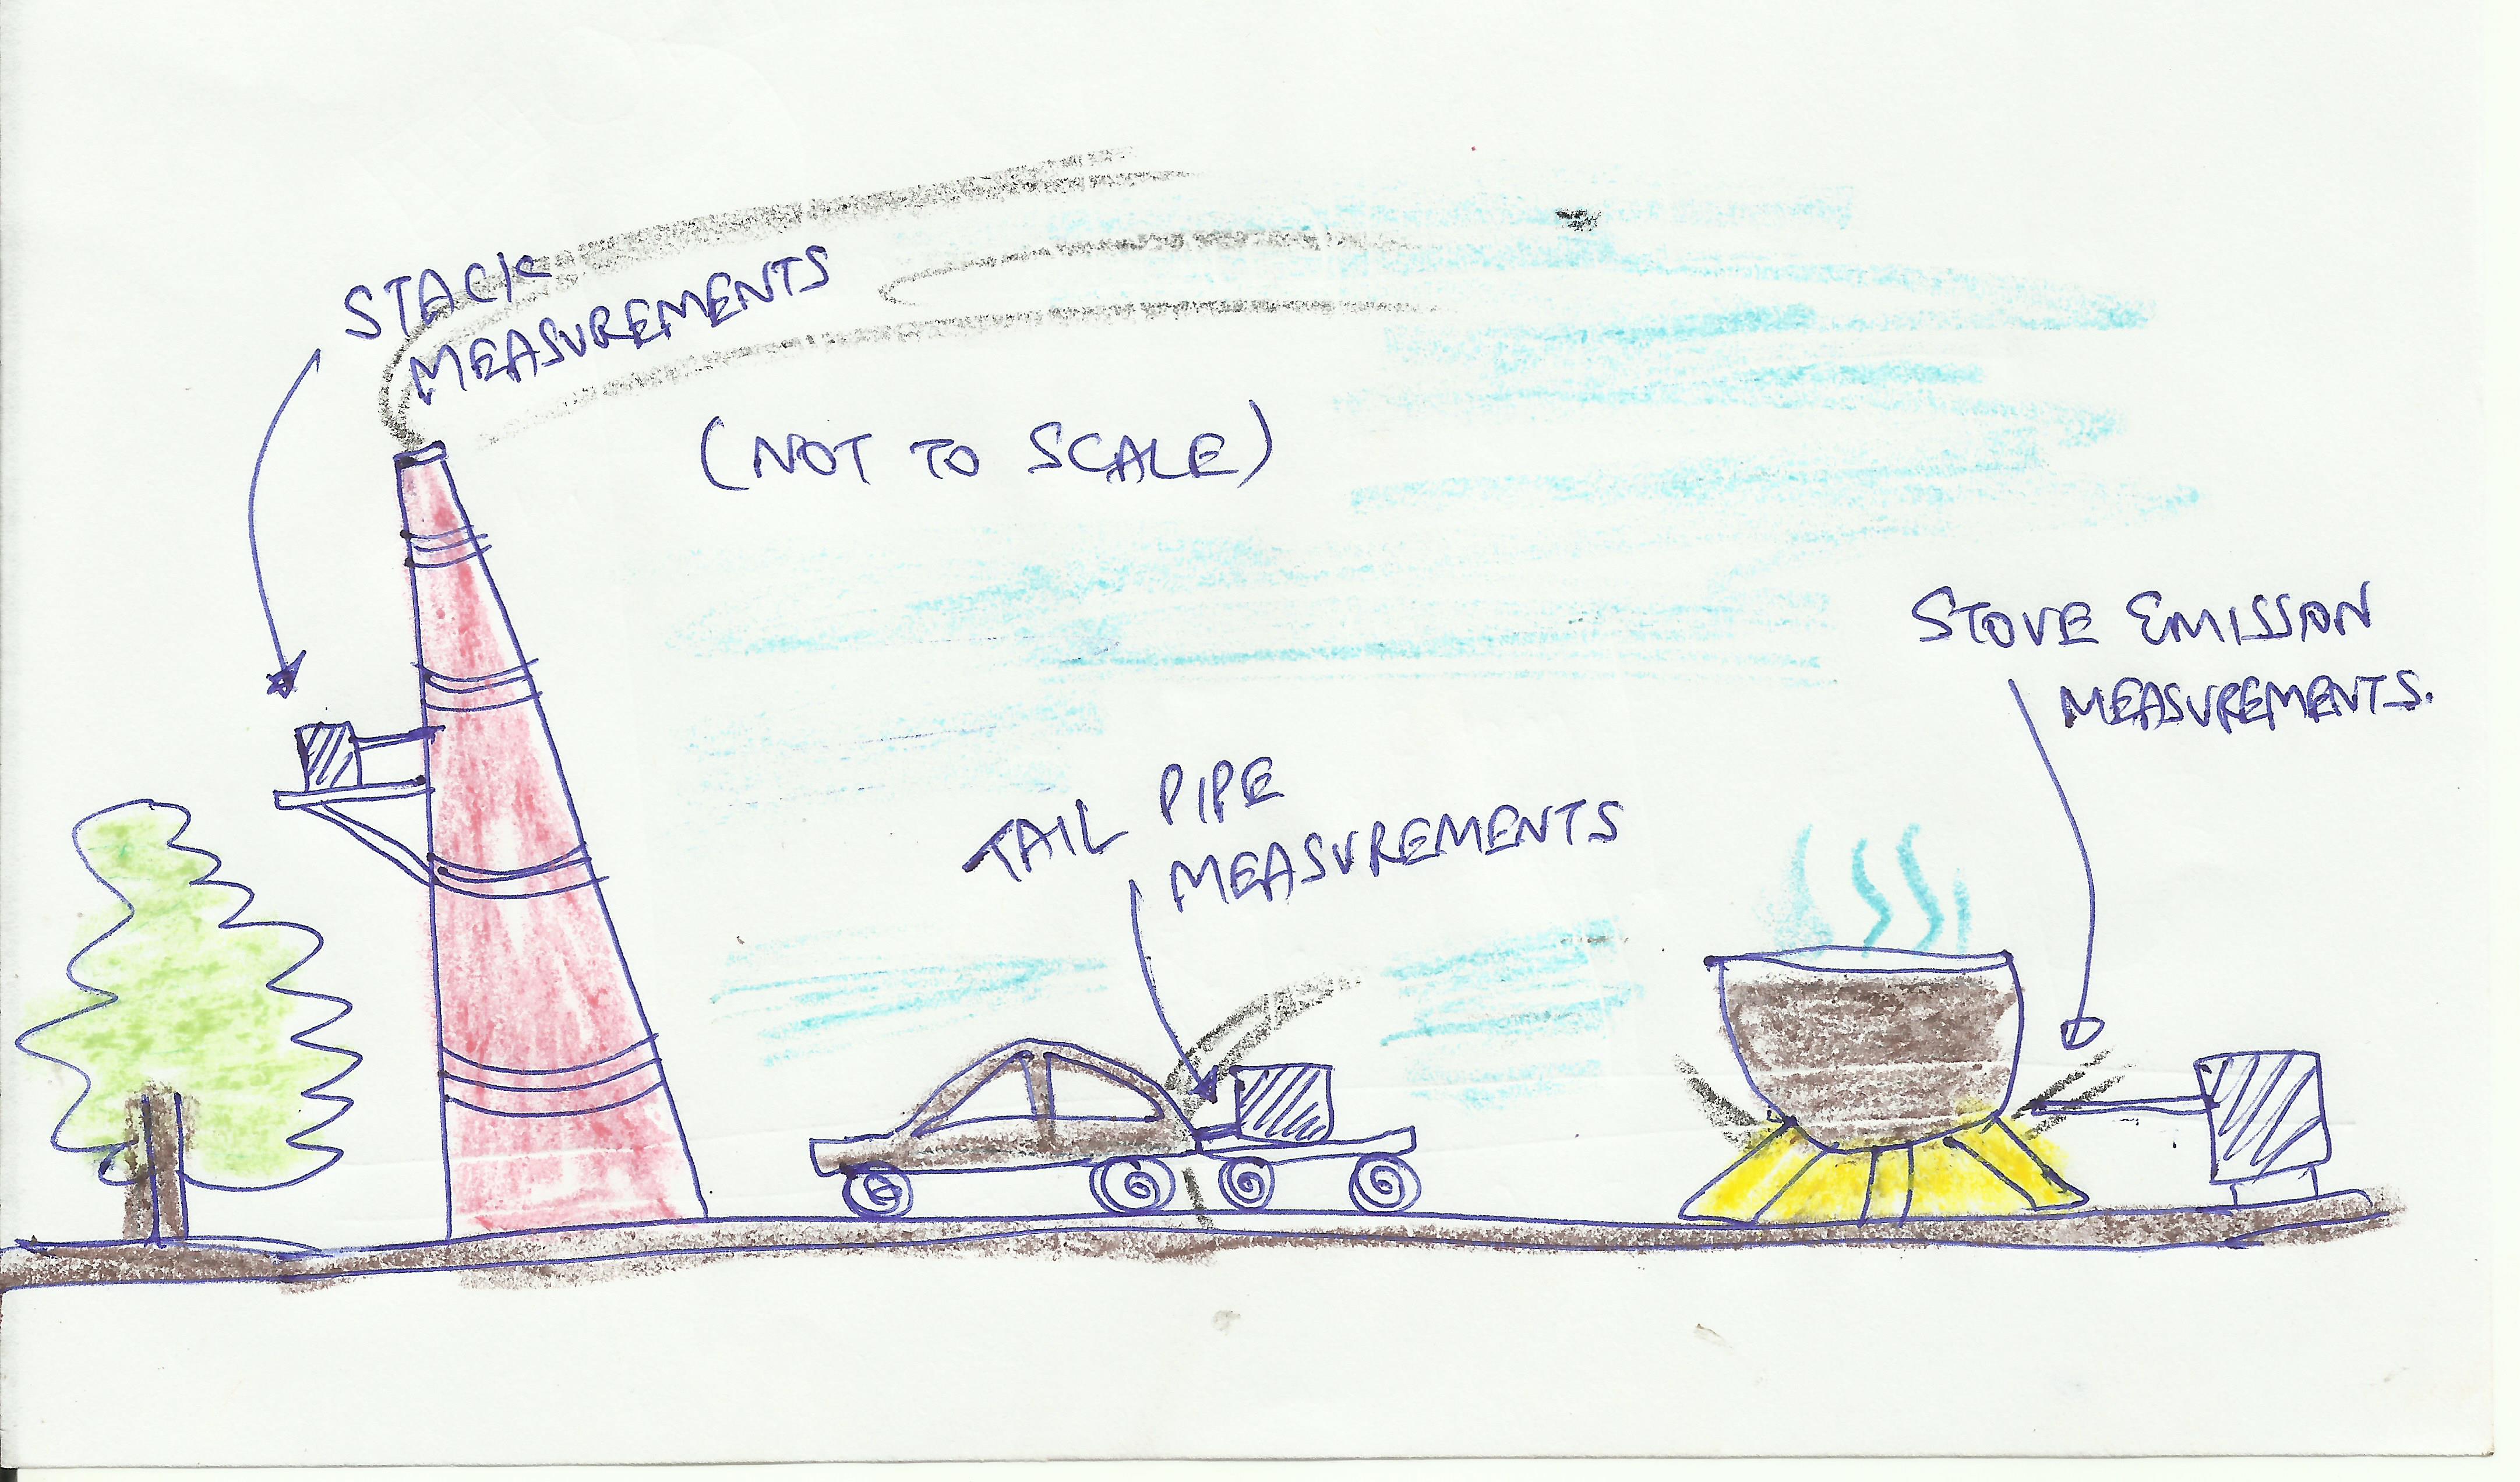
+ What is emissions monitoring?
Ambient pollution is what we breathe and this should not be confused with emissions at the sources. When we stick a probe into a tailpipe or into a stack and start taking measurements, the monitor will say that the emission rate is xx g/m3 – this is an instantaneous value of emissions out of the tail pipe or the stack. Only after this amount disperses and mixes with other sources, we have an ambient air pollution value.
 Like the ambient air standards, there are emission norms for most of the sectors. For example, every car, van, and jeep, gets a “pollution under control” (PUC) sticker, which means that vehicle is under the prescribed norms for that pollutant, but when you have one million vehicles running on the same roads, at the same time, the compound effect is different. Similarly for industries. Every industry is required to apply for an environmental clearance and the process does not include analysis for collective pollution loads in the industrial estate, but only for the individual plant.
There is a mandate for heavy industries to monitor air pollution at the stacks in real time. However, this information is not open for scrutiny or for use in research (for unknown reasons). Similarly, we have vehicles with Bharat-III or IV stickers (and soon Bharat VI, starting with Delhi), but the true emission rate of a vehicle is determined by its age, usage, and the roads it travels on, needs to be tested using a representative driving cycle for individual cities.
Today, most of the emission inventory work conducted for Indian cities is carried out using borrowed emission rates or constructed emission rates based on in-use technology or emissions rates adjusted for the conditions pertinent to the local activities. While we want to understand how much we are breathing and which pollutant, in order to better understand how much of that pollutant is coming from which source, we also need to invest in emissions monitoring.
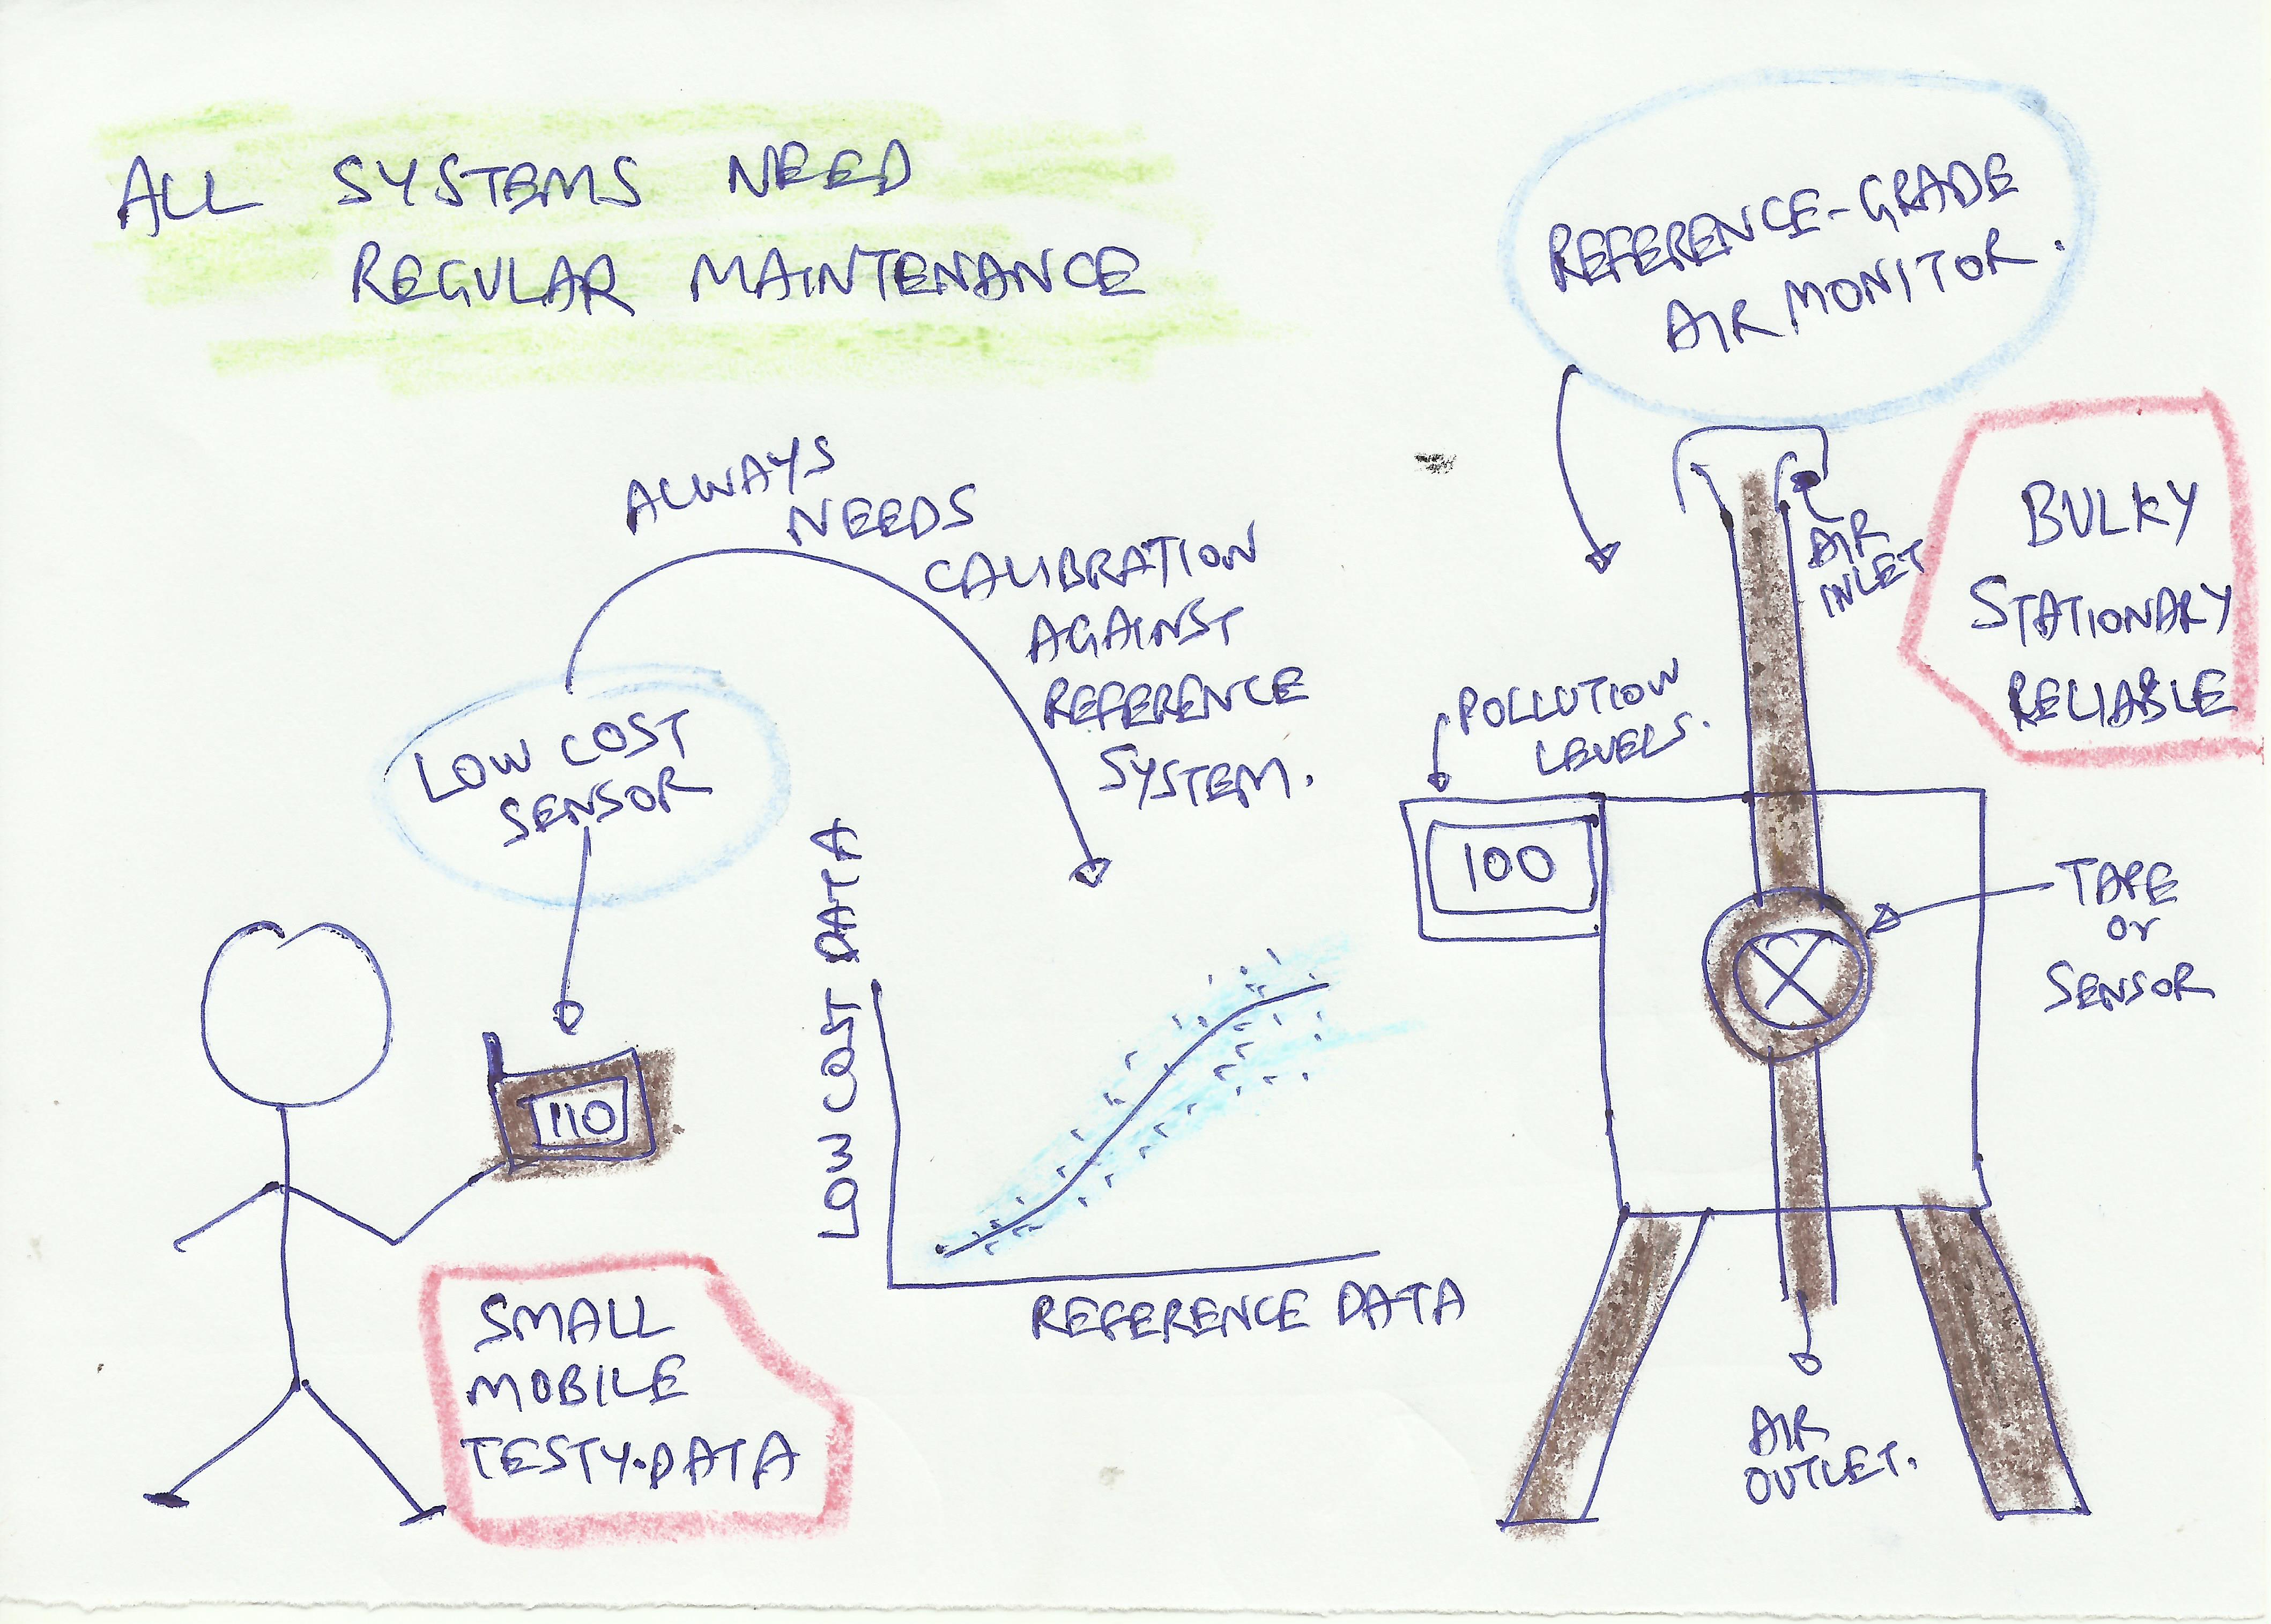
+ What is low-cost air pollution monitoring?
Low cost monitors have become a popular alternative to government monitoring data and has the potential to increase the pool of monitoring data. In general, these alternative sensors can help create a faster and cheaper heat map of the pollution levels in the city; can help reach the parts of the city, which are not possible to reach using standard monitors; and supplement that an expanding regulatory grade network in any city. However, if the data is meant to support long-term air quality management plans for the city, this data should be analyzed with caution, and utilized only if the equipment passes the required calibration and maintenance protocols. If un-calibrated or not used correctly, the readings will be biased and more importantly will not be accepted by policymakers as a diagnostic.
 These are a fairly new development and have become especially popular because of the increases in air pollution during the winter months in north India, coupled with the fact that residents were unable to get reliable data from the government. Hence they had to resort to their own means of finding out what the air quality was (and is). Over the years, the quality of low cost monitors will improve and hopefully the government will also increase the number of monitors and provide real time access to citizens, negating the need for them to resort to their own measures.
Here are some comparisons and notes of low-cost sensors and what to look for when buying one; and one operational low-cost sensor network in India by Urban Sciences.
+ What are the basic uses of air pollution monitoring data?
The most basic usage of monitoring data is summarized below.
| Focus area | Usage | |
|---|---|---|
| Ambient monitoring | the whole city or state or country | Data is used for long-term spatial and temporal trend analysis; can be used to determine the merits and the de-merits of an intervention over time |
| On-road (mobile) monitoring | confined to roads and their immediate vicinity | Data is used for understanding pollution exposure during commute; specially to understand the acute health impacts of being exposed to augmented pollution levels on the roads |
| Satellite monitoring | the whole city or state or country | Data is used mostly for annual scale pollution trend analysis |
| Emissions monitoring | a specific source | Data is used to establish the emission rate by source, by fuel, by technology, and by usage |
+ How monitoring data is used for health exposure assessments?
 Health impacts are the primary reason for worrying about the deteriorating air quality. One of the biggest uses of a reliable ambient air monitoring data is to establish a credible nexus with health impacts, which range from cases of ischemic heart disease (which can lead to heart attacks), cerebrovascular disease (which can lead to strokes), chronic obstructive pulmonary diseases, lower respiratory infections, and cancers (in trachea, lungs, and bronchitis). There is also a growing evidence linking air pollution with obesity, diabetes, and Alzheimer’s disease. According to the recent global burden of disease (GBD) estimates, in 2016, estimated premature deaths are 1,030,000 due to outdoor and 780,000 due to household PM2.5 pollution. Similar estimates were published by Indian researchers as well, which were categorically rejected by the Environment ministers, on multiple occasions.
The only way to better understand the impact of air pollution on our health and using it to establish an effective long-term air quality management plan, is by understand the chronic pollution exposure levels. The health impact assessments are based on long-term ambient monitoring trends and long-term hospital records. The analysis is often conducted on an annual basis for a city or a country, or for the whole globe (like the GBD work), and never for a road or for a day. The focus here is on the impacts of chronic exposure to air pollution. For example, if the city is averaging 100 μg/m3 of PM2.5 for 365 days, then the likely impact of this chronic exposure can be linked to so many premature deaths in a year due to an increase in the incidence of cardio-vascular diseases, and so on.
There are acute health impacts when exposed to high concentrations over a short period of time, such as, eye irritations, shortness of breath, inflamed sinusitis, asthma aggravation, nausea, and skin irritations; all of them have studied links to all the criteria pollutants at various levels.
Like the ambient monitoring and emissions monitoring in India, the work involved in understanding the chronic and acute health impacts on urban and rural population is lacking. The current understanding on how air pollution effects human organs, is based on studies conducted outside India. That shouldn’t be the reason to assume immunity to air pollution. More studies linking health impacts and air pollution will strengthen the case for stricter regulations and aggressive implementation of cleaner options in India, but let us not stop or wait till that happens.
+ How monitoring data can help validate modeling work?
More stations mean larger the data pool, to better understand the spatial and the temporal trends in pollution, and more support to the modeling efforts trying to understand these trends (e.g. https://www.indiaairquality.info)
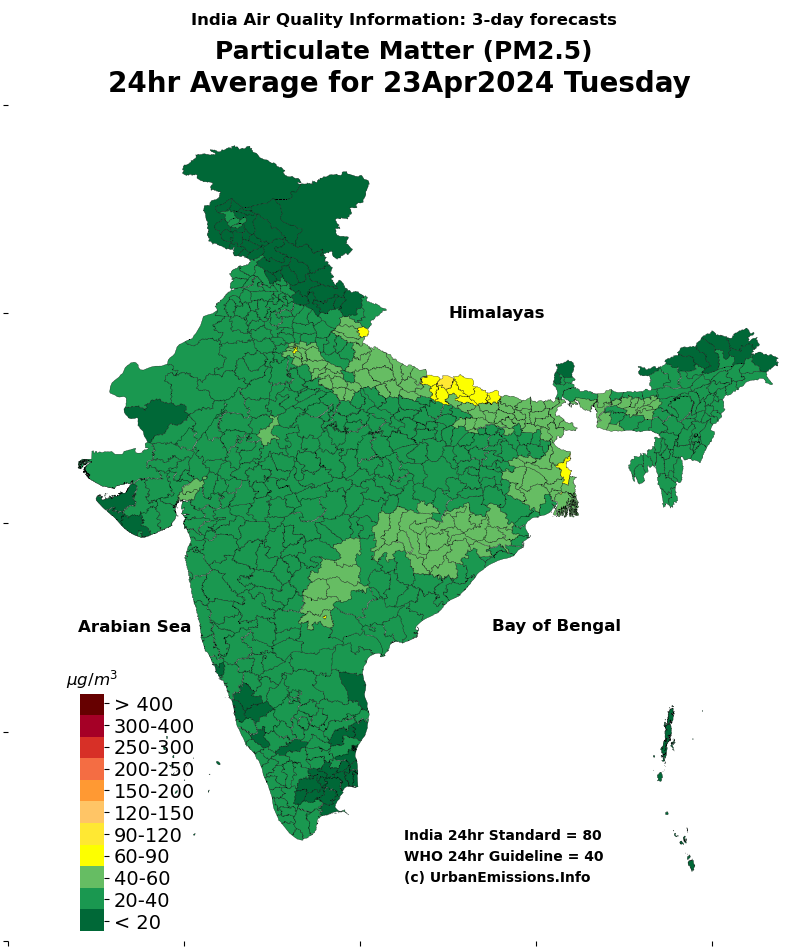
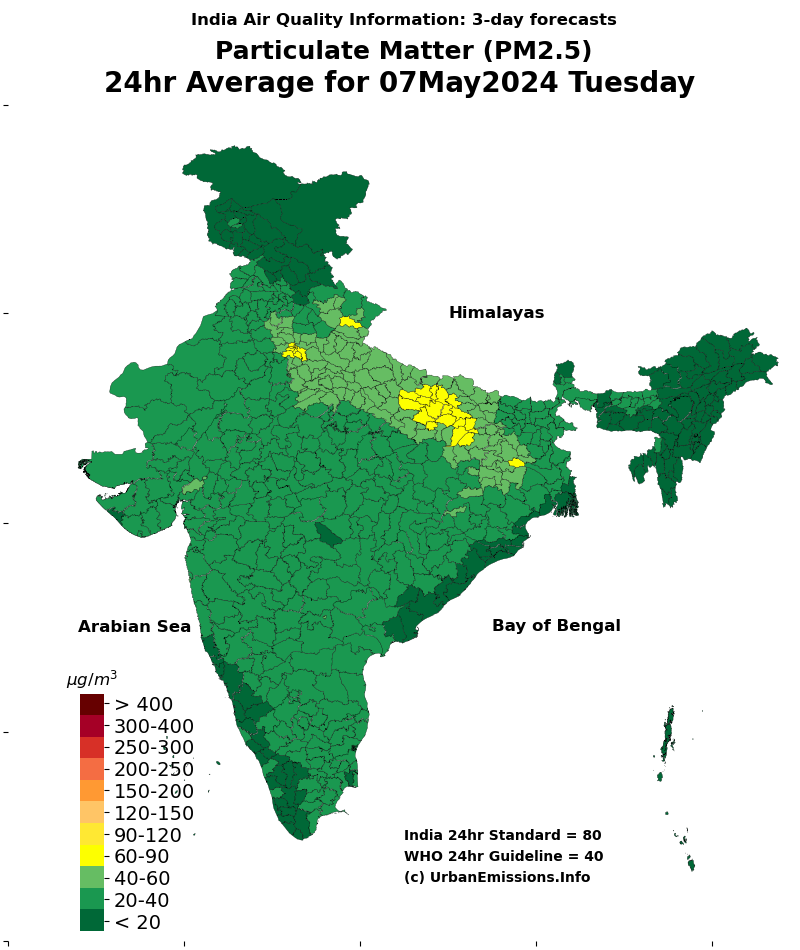
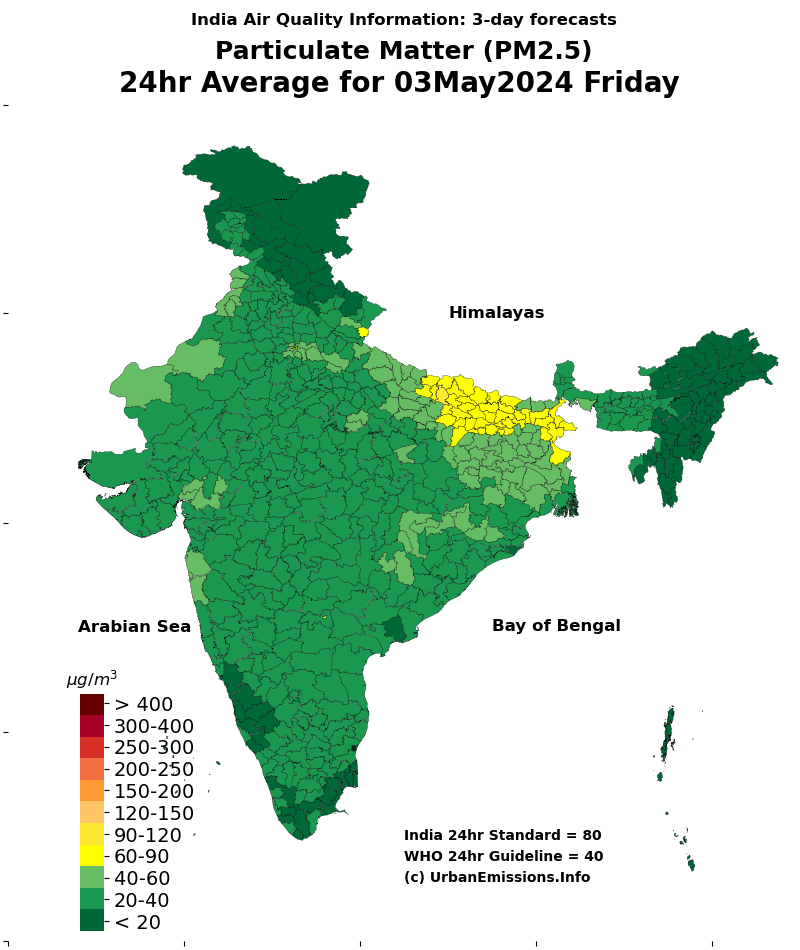
Modeled PM2.5 Concentrations (Forecast Mode)
 |
 |
 |
 |
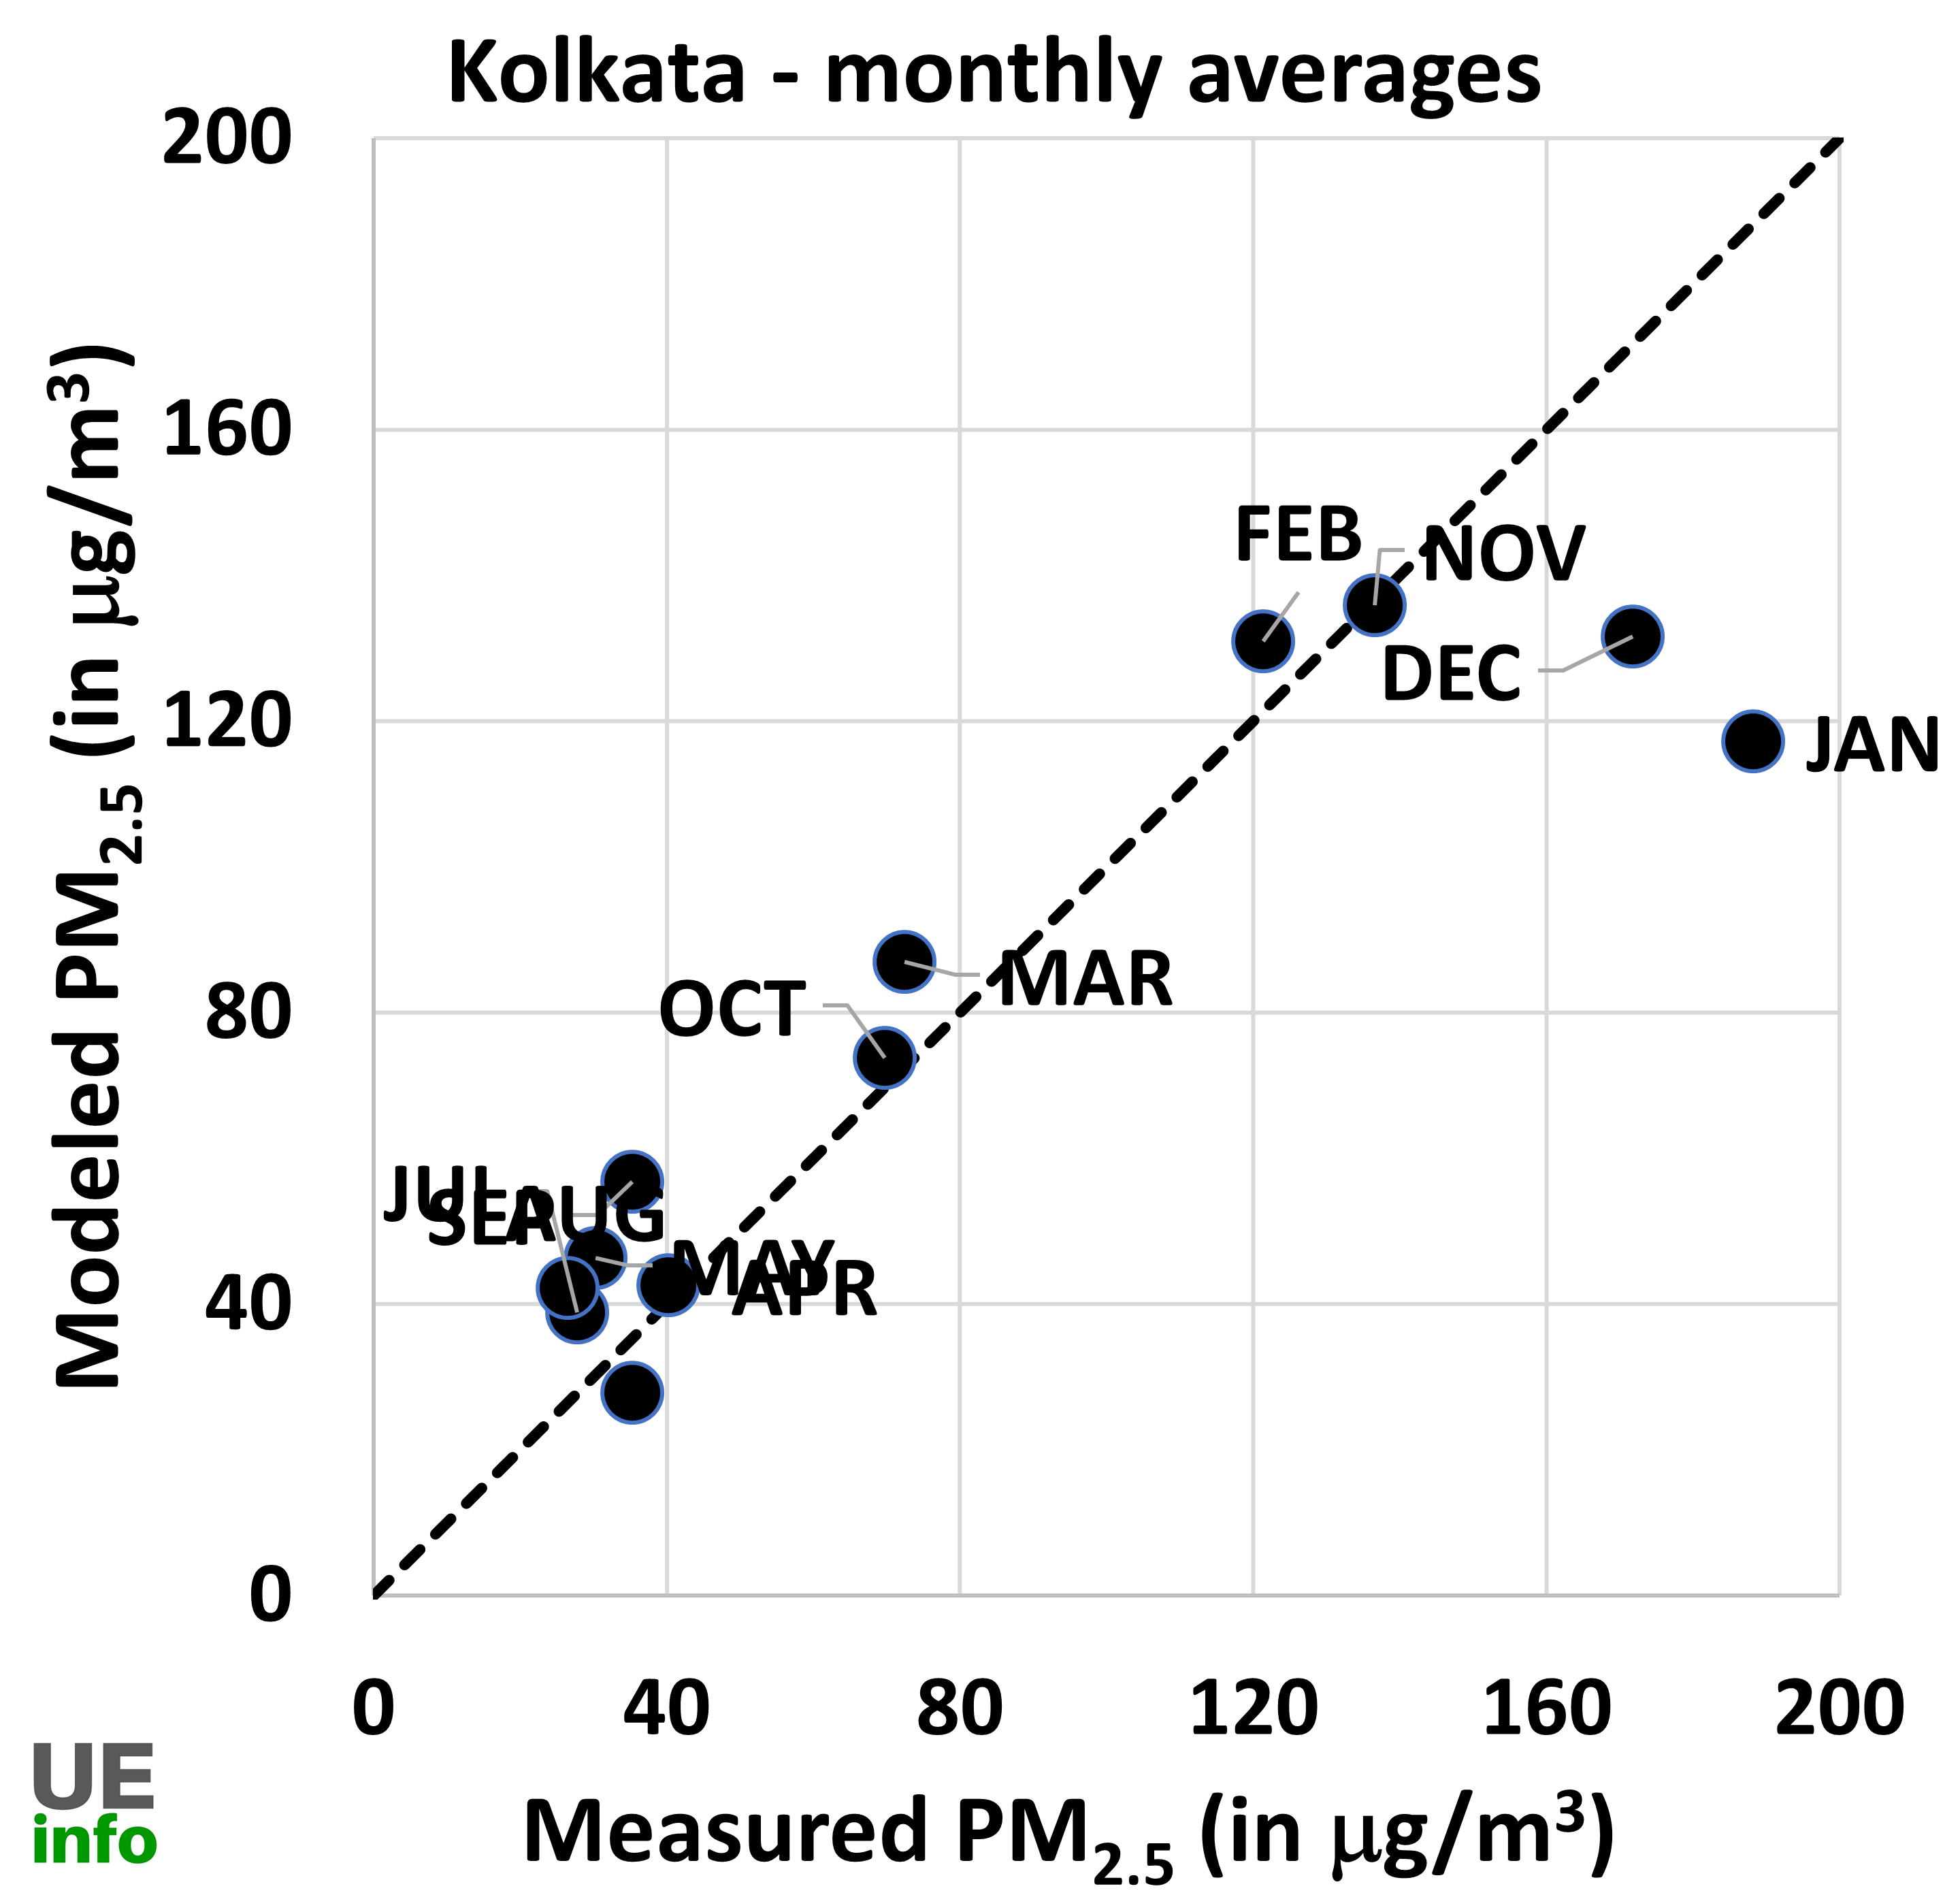
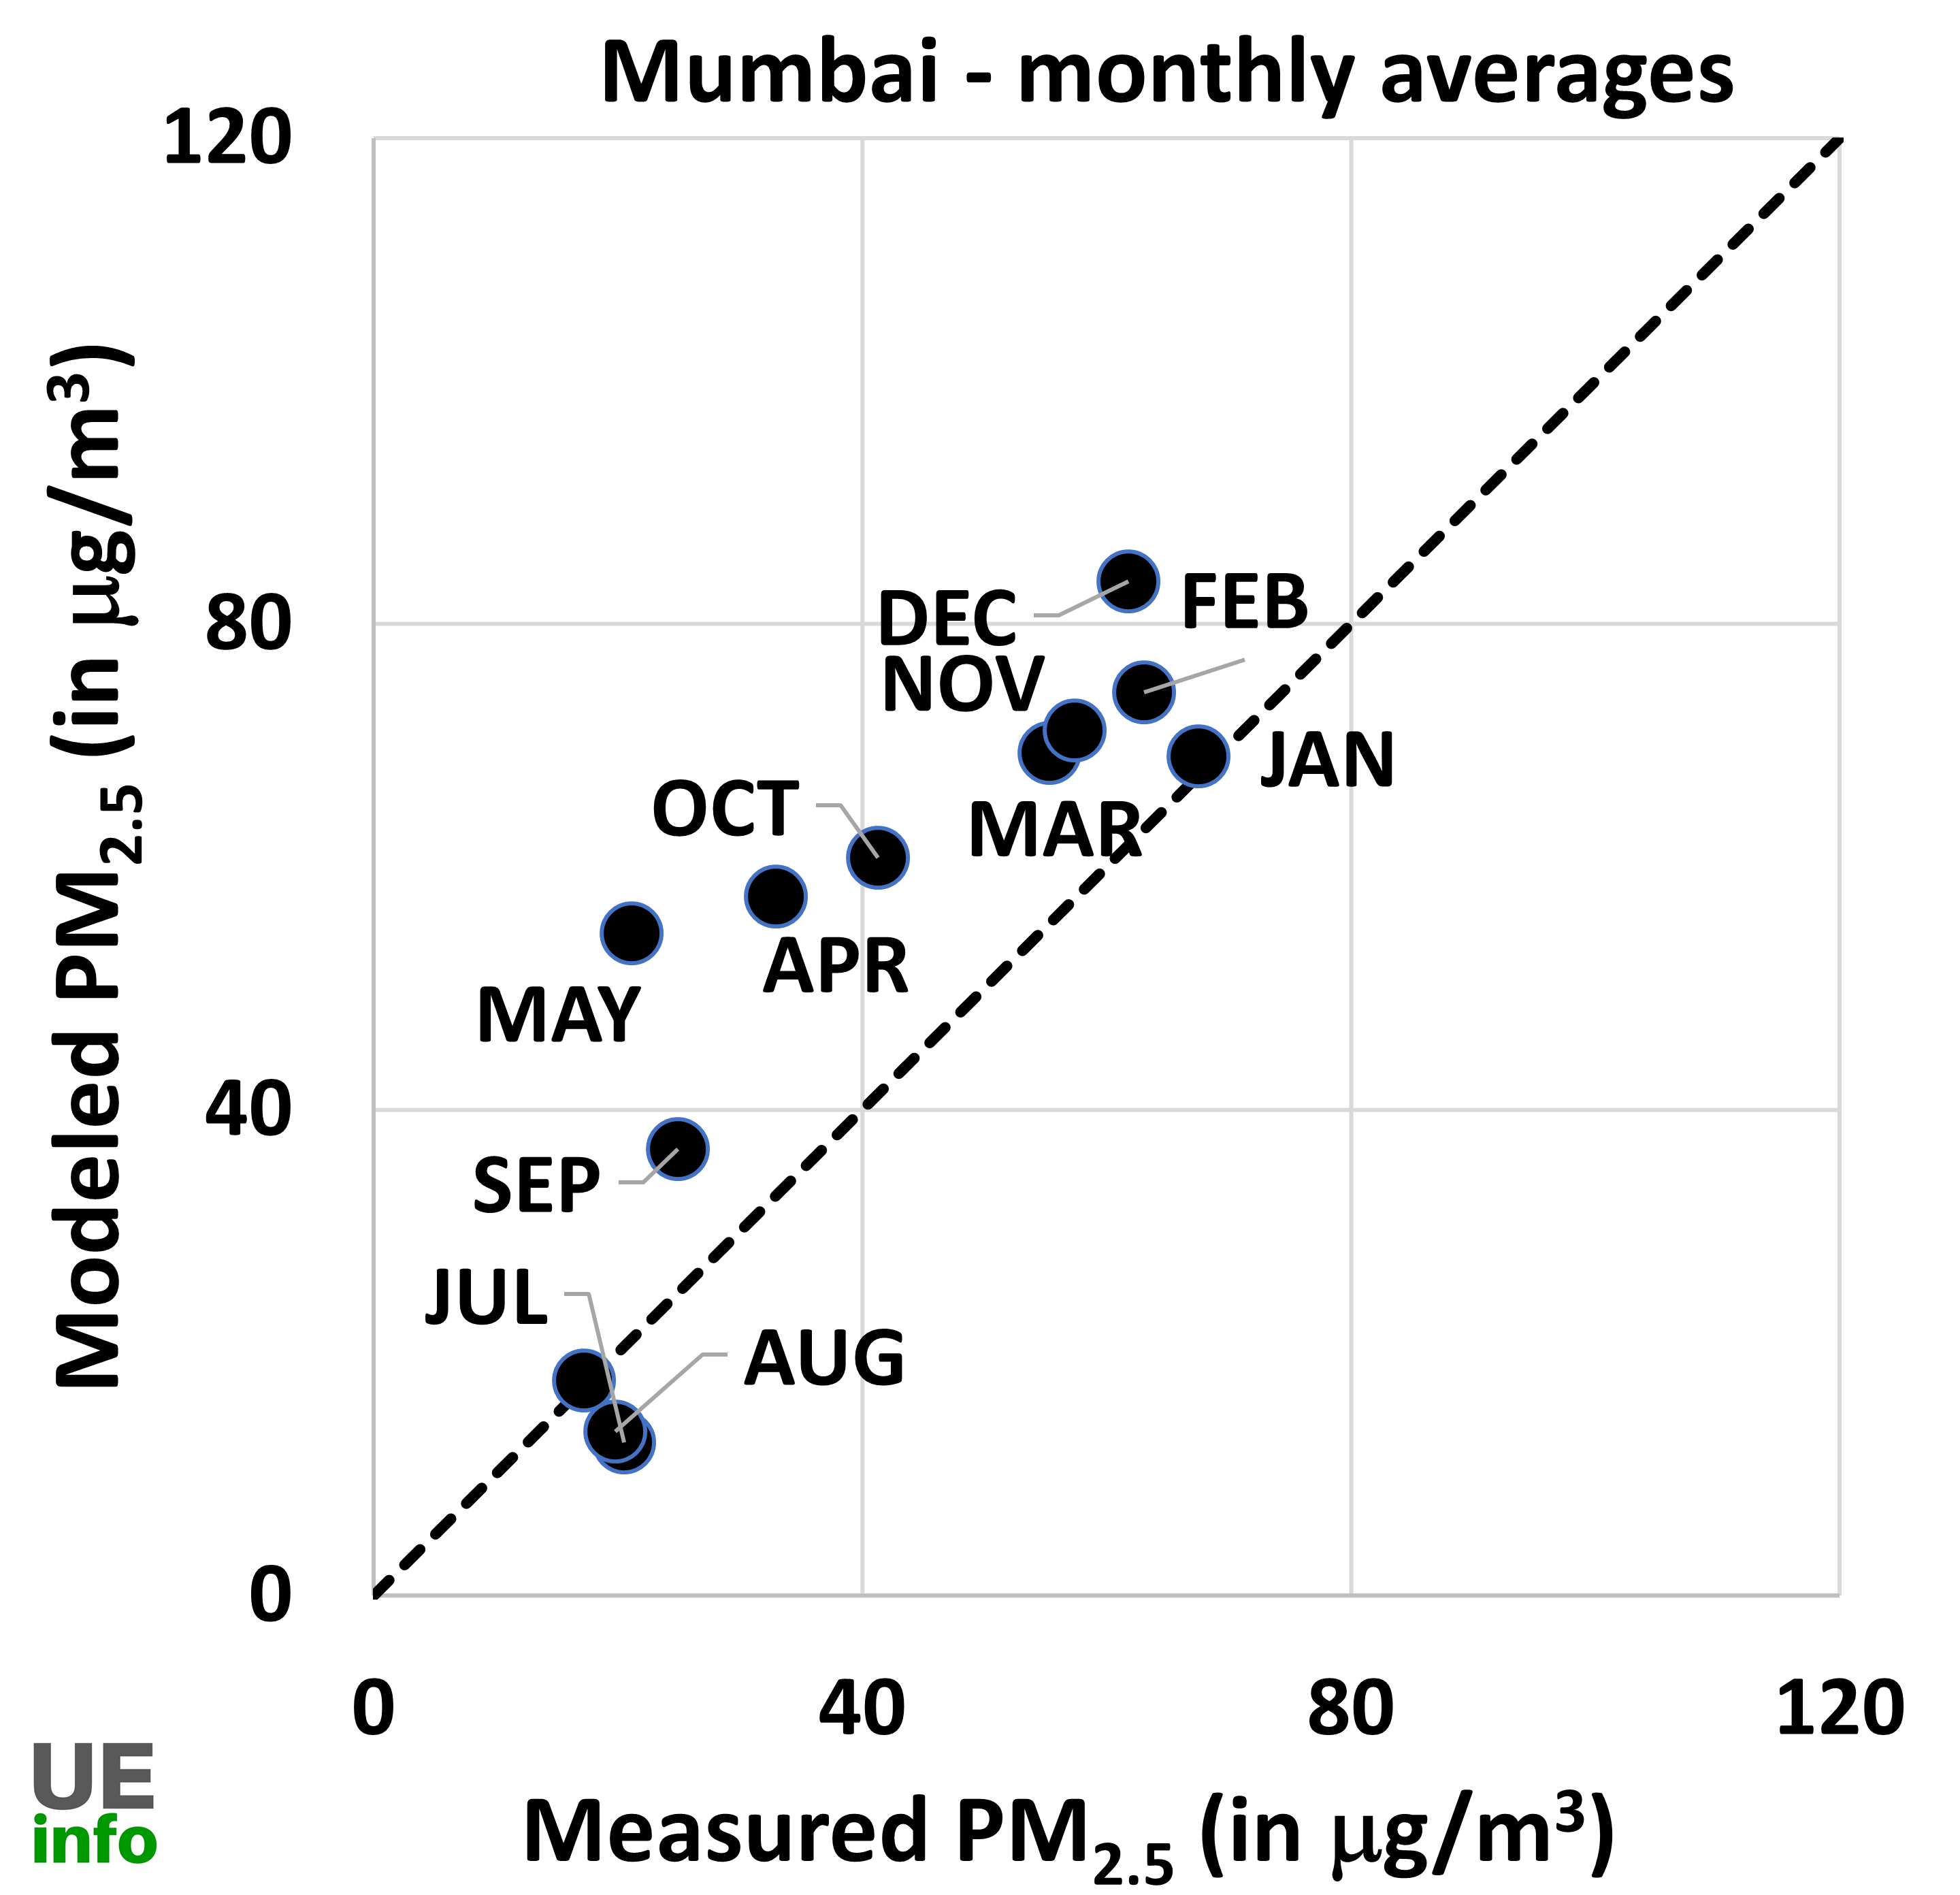
As part of the Air Pollution knowledge Assessments (APnA) city program, we put together databases from disparate sources to establish an emissions inventory for the city airsheds and processed them to a chemical transport model to estimate ambient concentrations. All the data for PM2.5 concentrations from the continuous monitoring stations, for the period of 2018-19, was consolidated and compared against these model results. The scatter plot presents a comparison of 24-hr average PM2.5 concentrations by month. Modeled data is for the urban parts of the city. To be able to replicate the spatial and temporal trends in the concentrations over multiple cities, validates the emissions inventory, which can be further used for scenario analysis and policy dialogue.
Comparison of Modeled vs. Measured PM2.5 Concentrations (Hindcast Mode)
 |
 |
 |
 |
+ Reference material
- Air Sensor Guidebook, by US EPA, 2014 (link)
- A brief history of air quality sensing, by Tim Dye, 2017 (link)
- A repository of global official monitoring data, by OpenAQ (link)
- Technical specifications of continuous ambient air quality monitoring, CPCB India (link)
- Guidelines for continuous emissions monitoring, CPCB India, 2017 (link)