March, 2023: A review of Delhi’s air quality from 1990 to 2022 from data, sectoral, judicial, and institutional perspectives was published in Sustainability (MDPI) as an open access journal article. Air pollution in (urban and rural) India is a growing public concern, and city of Delhi (its capital) is one of the most studied city with a disproportionate share of media attention. Yet, we do not seem to have decisive answers to simple questions like how polluted is the city, what are the main sources, and where to start to control pollution in the city. In this review article, databases and story lines covered are the following
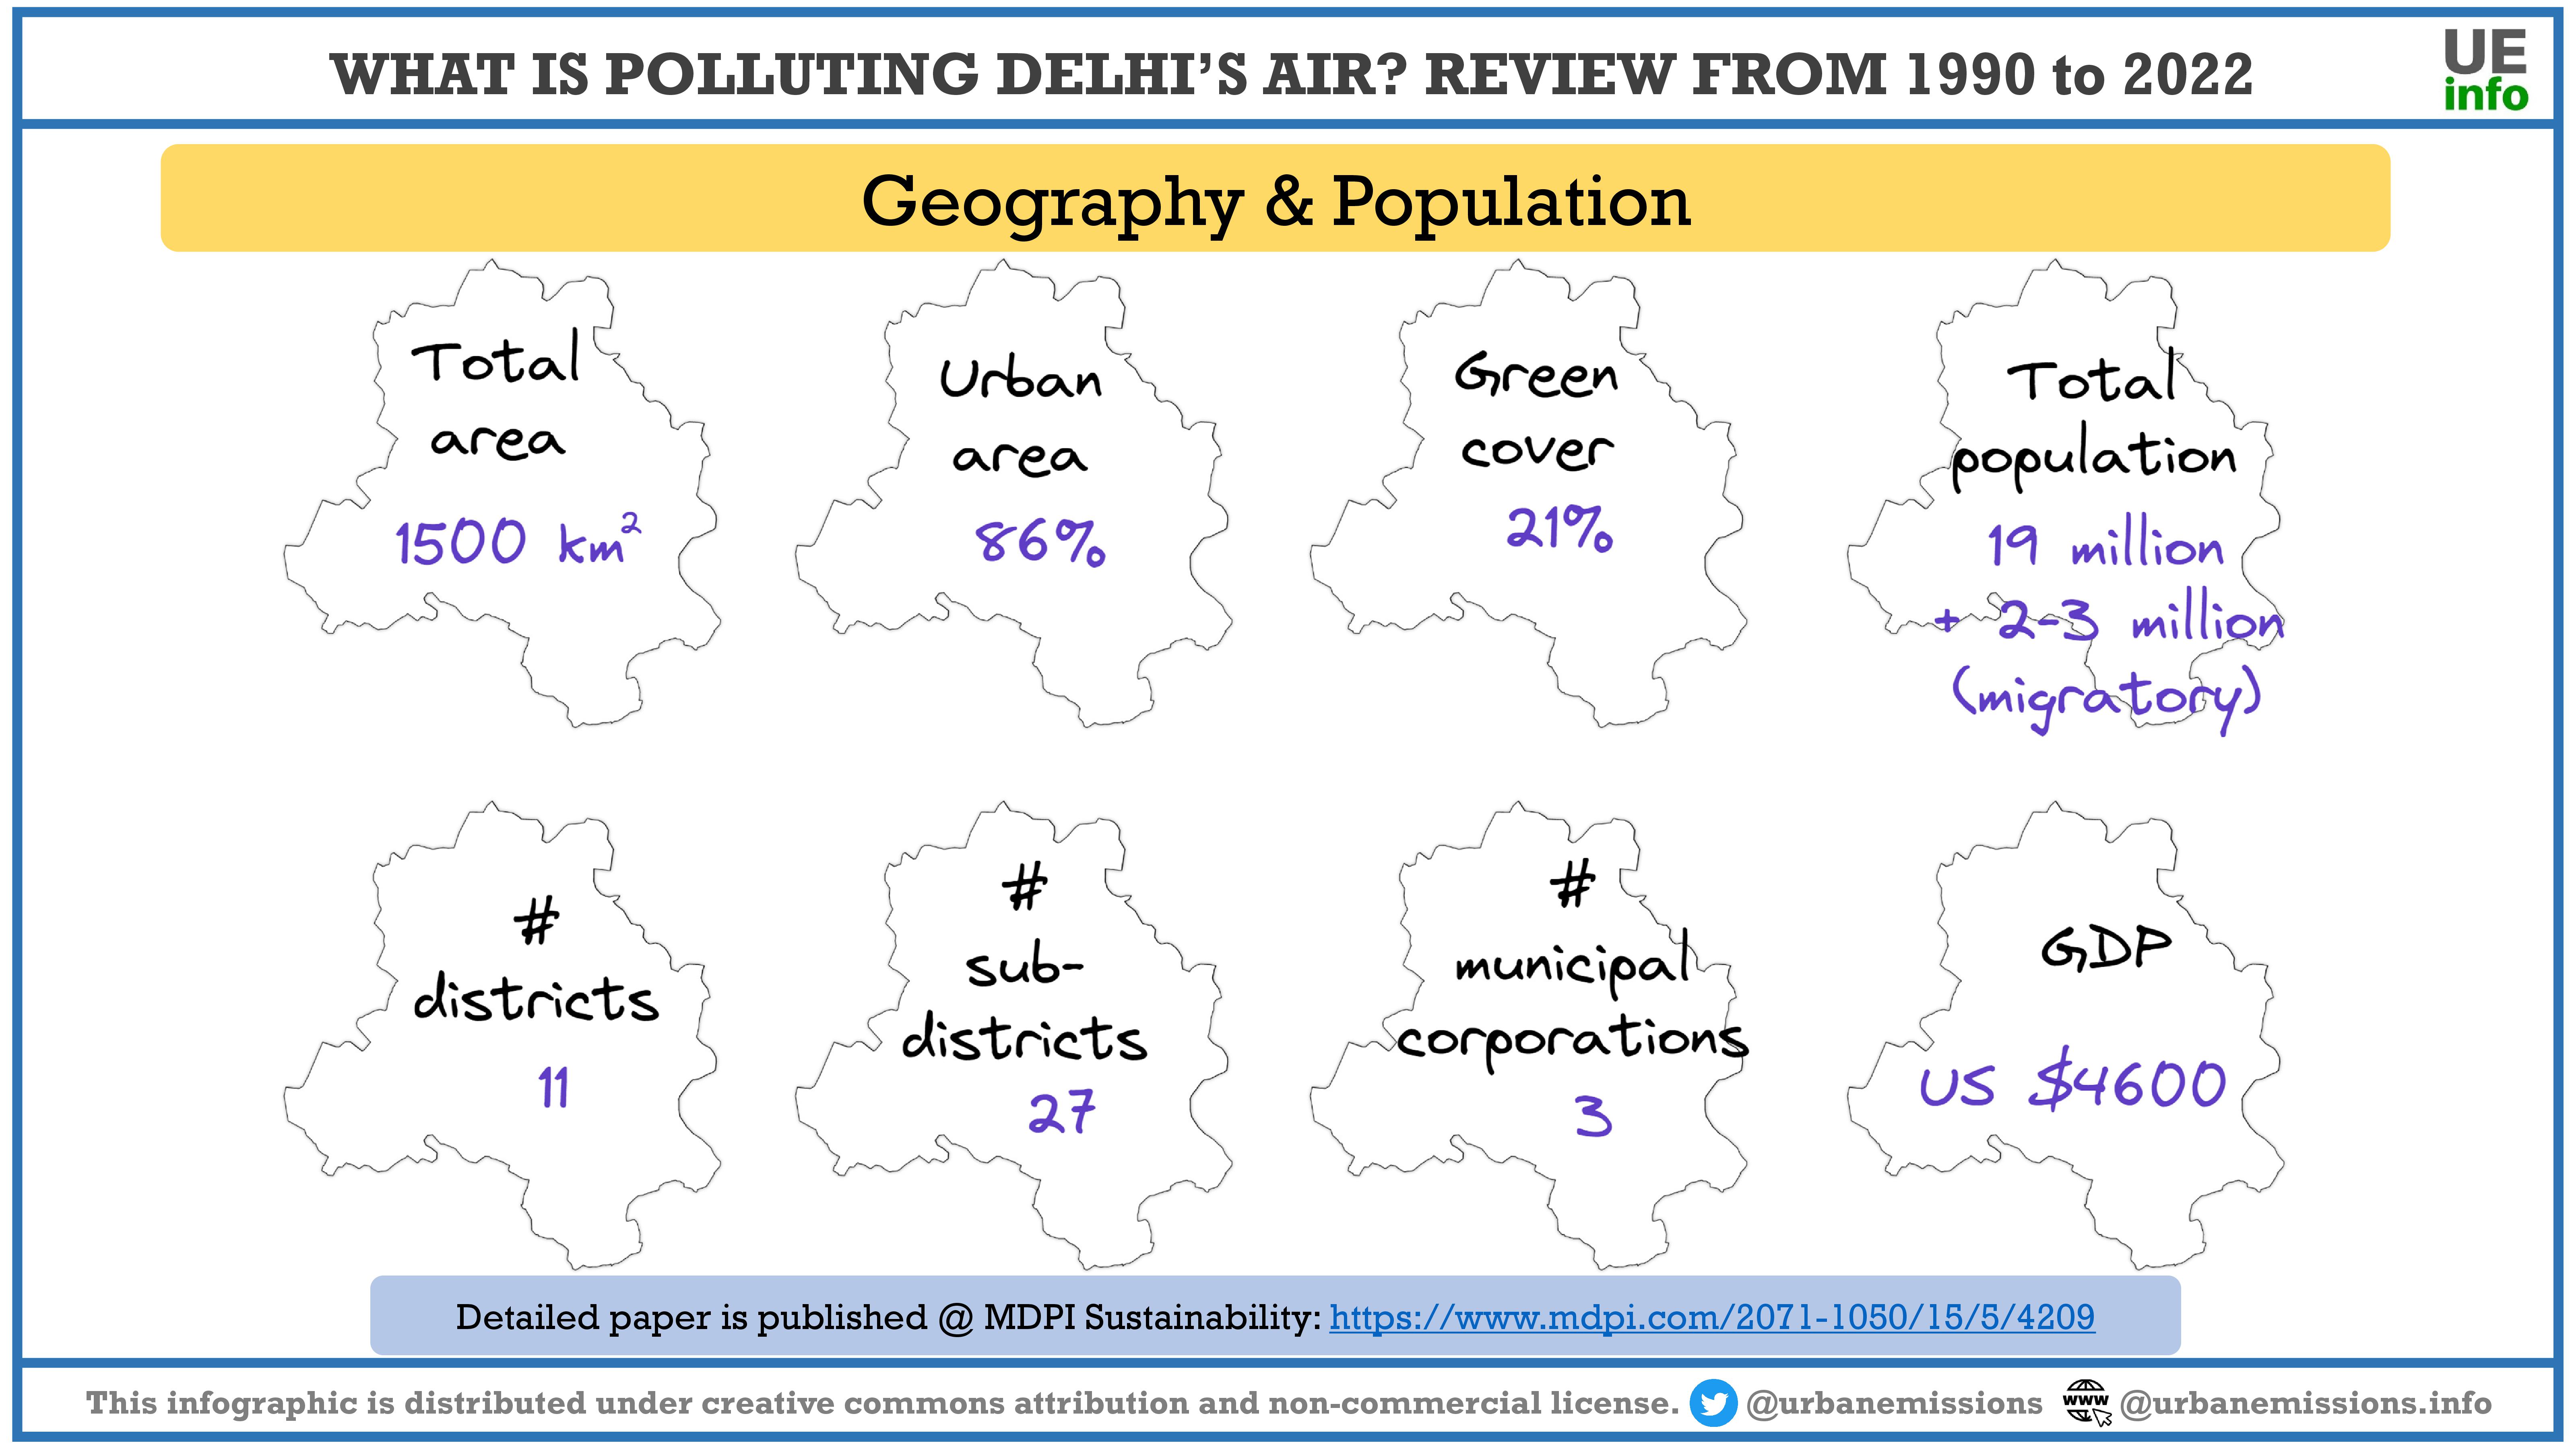
- Geography and meteorology
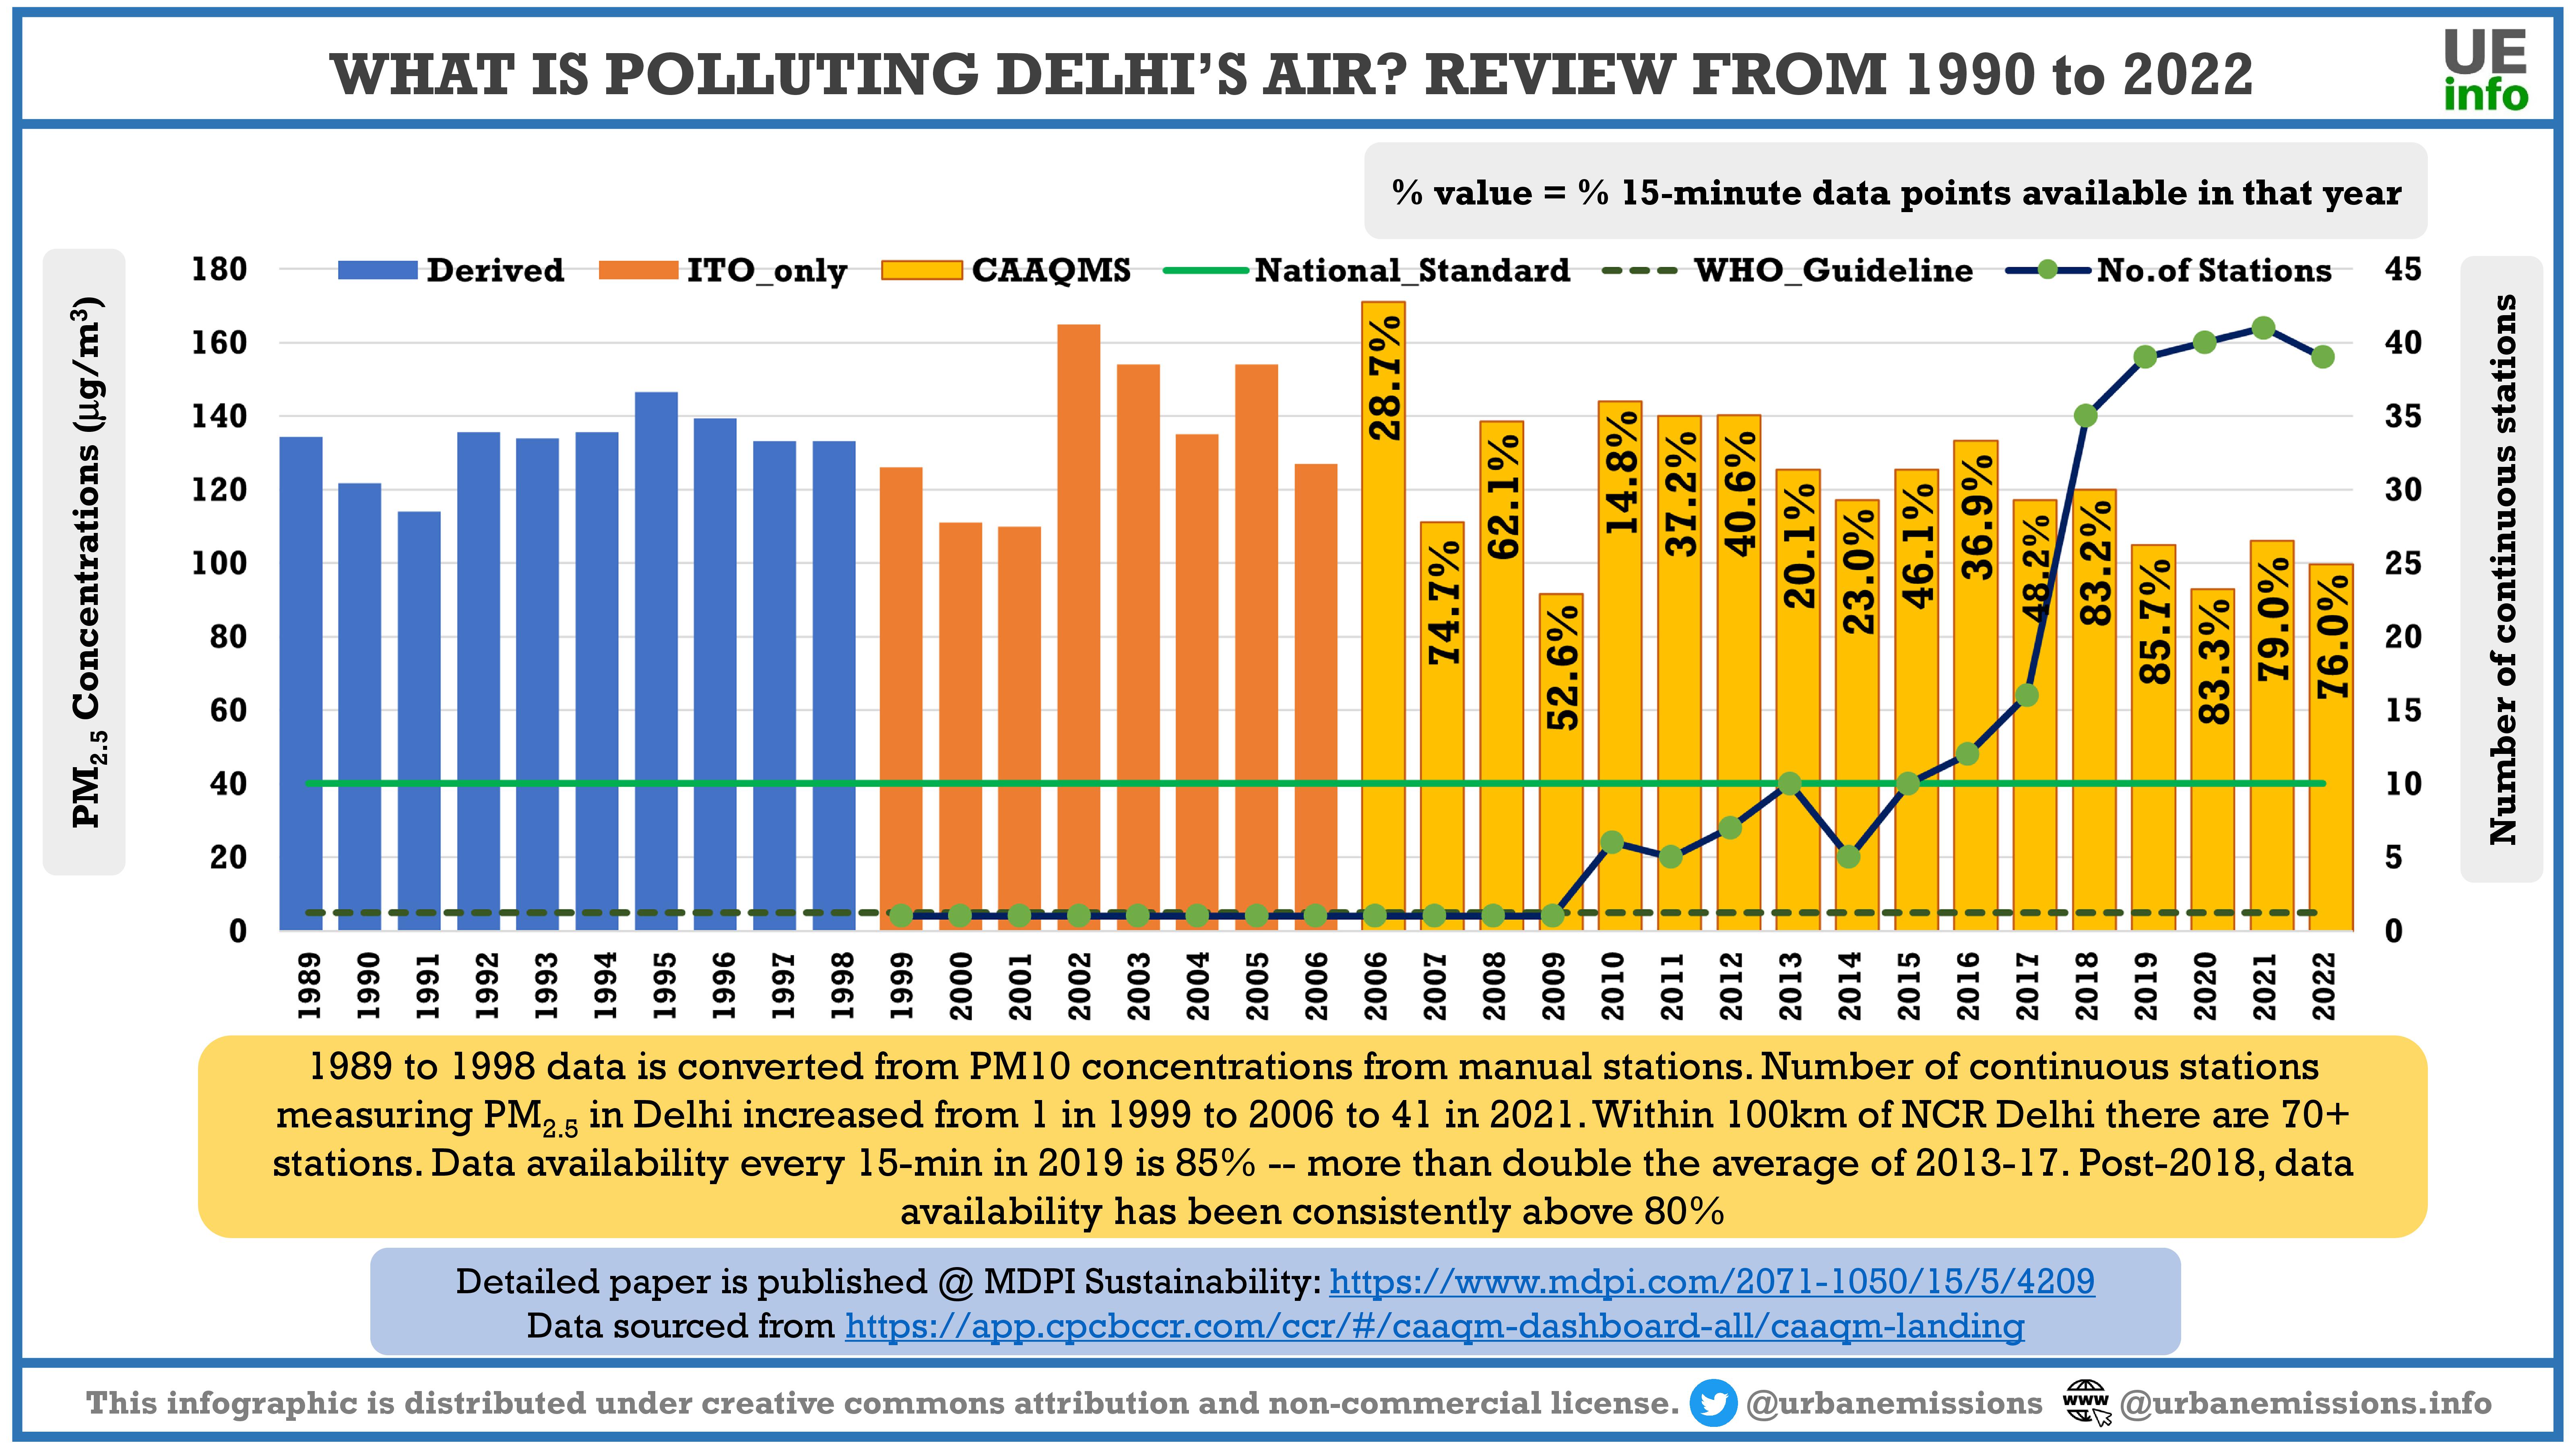
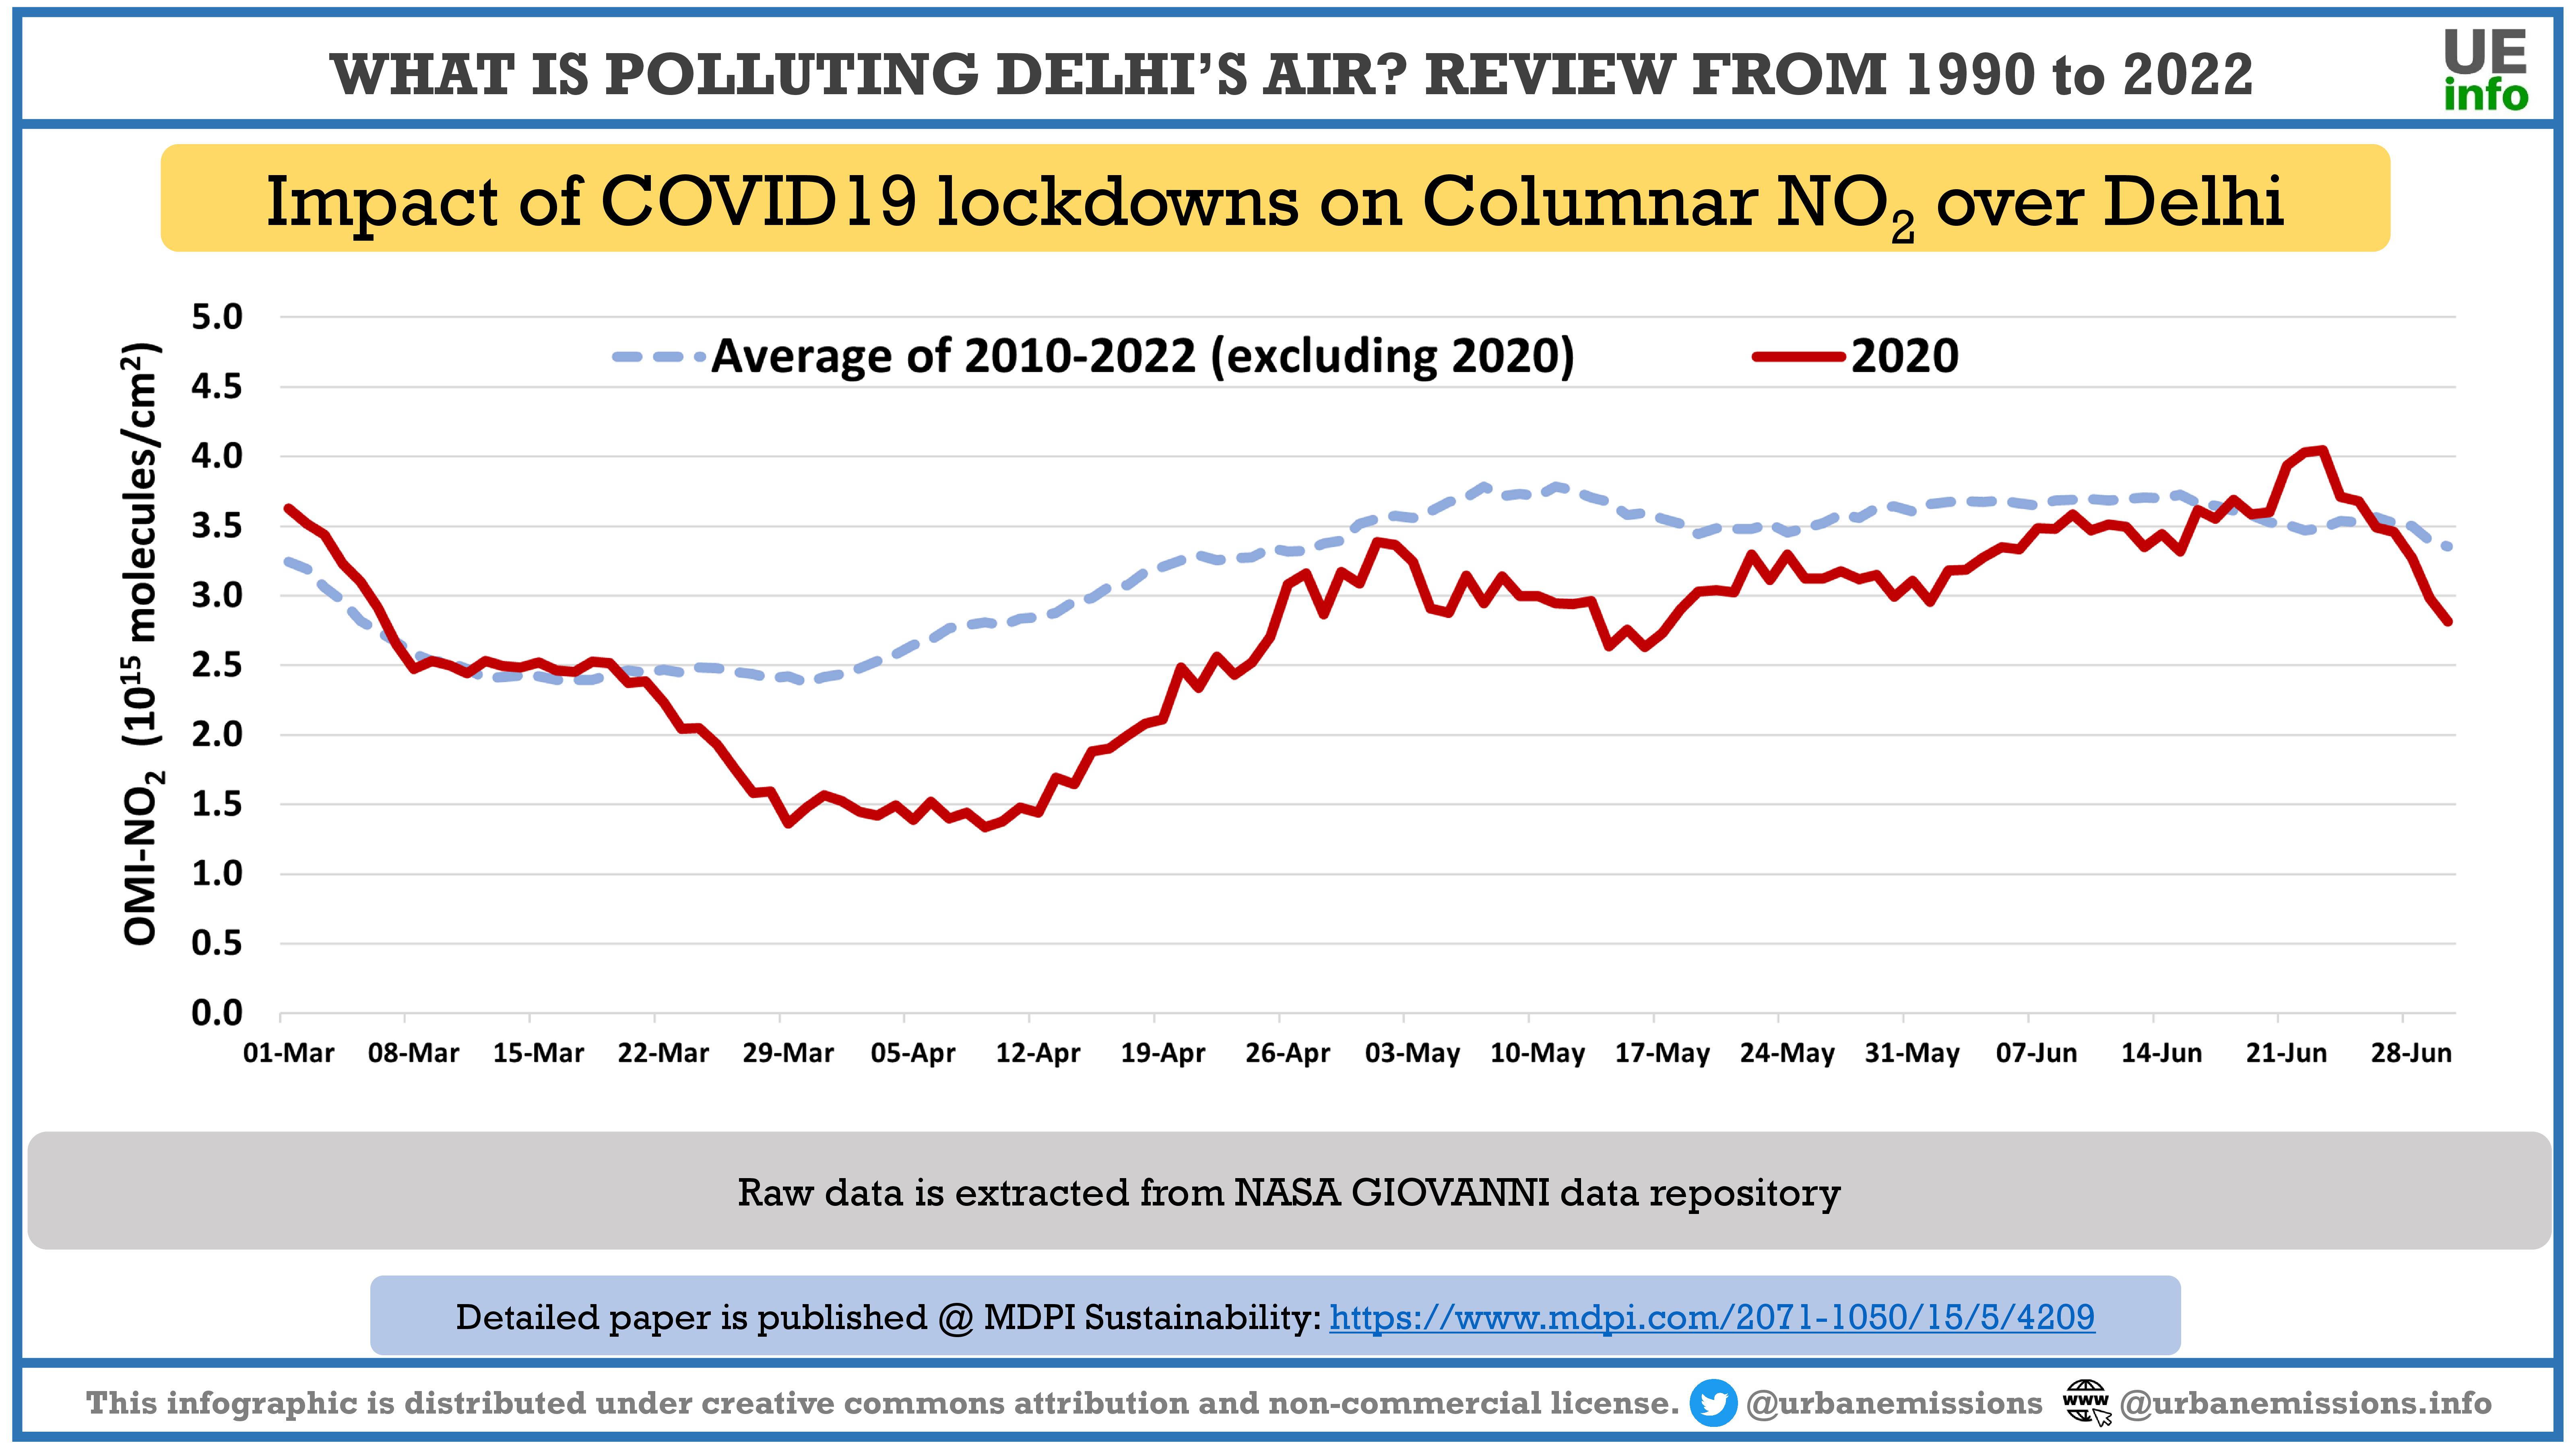
- Changes in ambient air quality (as PM2.5 concentrations) using information from ground measurements, reanalysis fields, and satellite retrievals
- Source apportionment studies
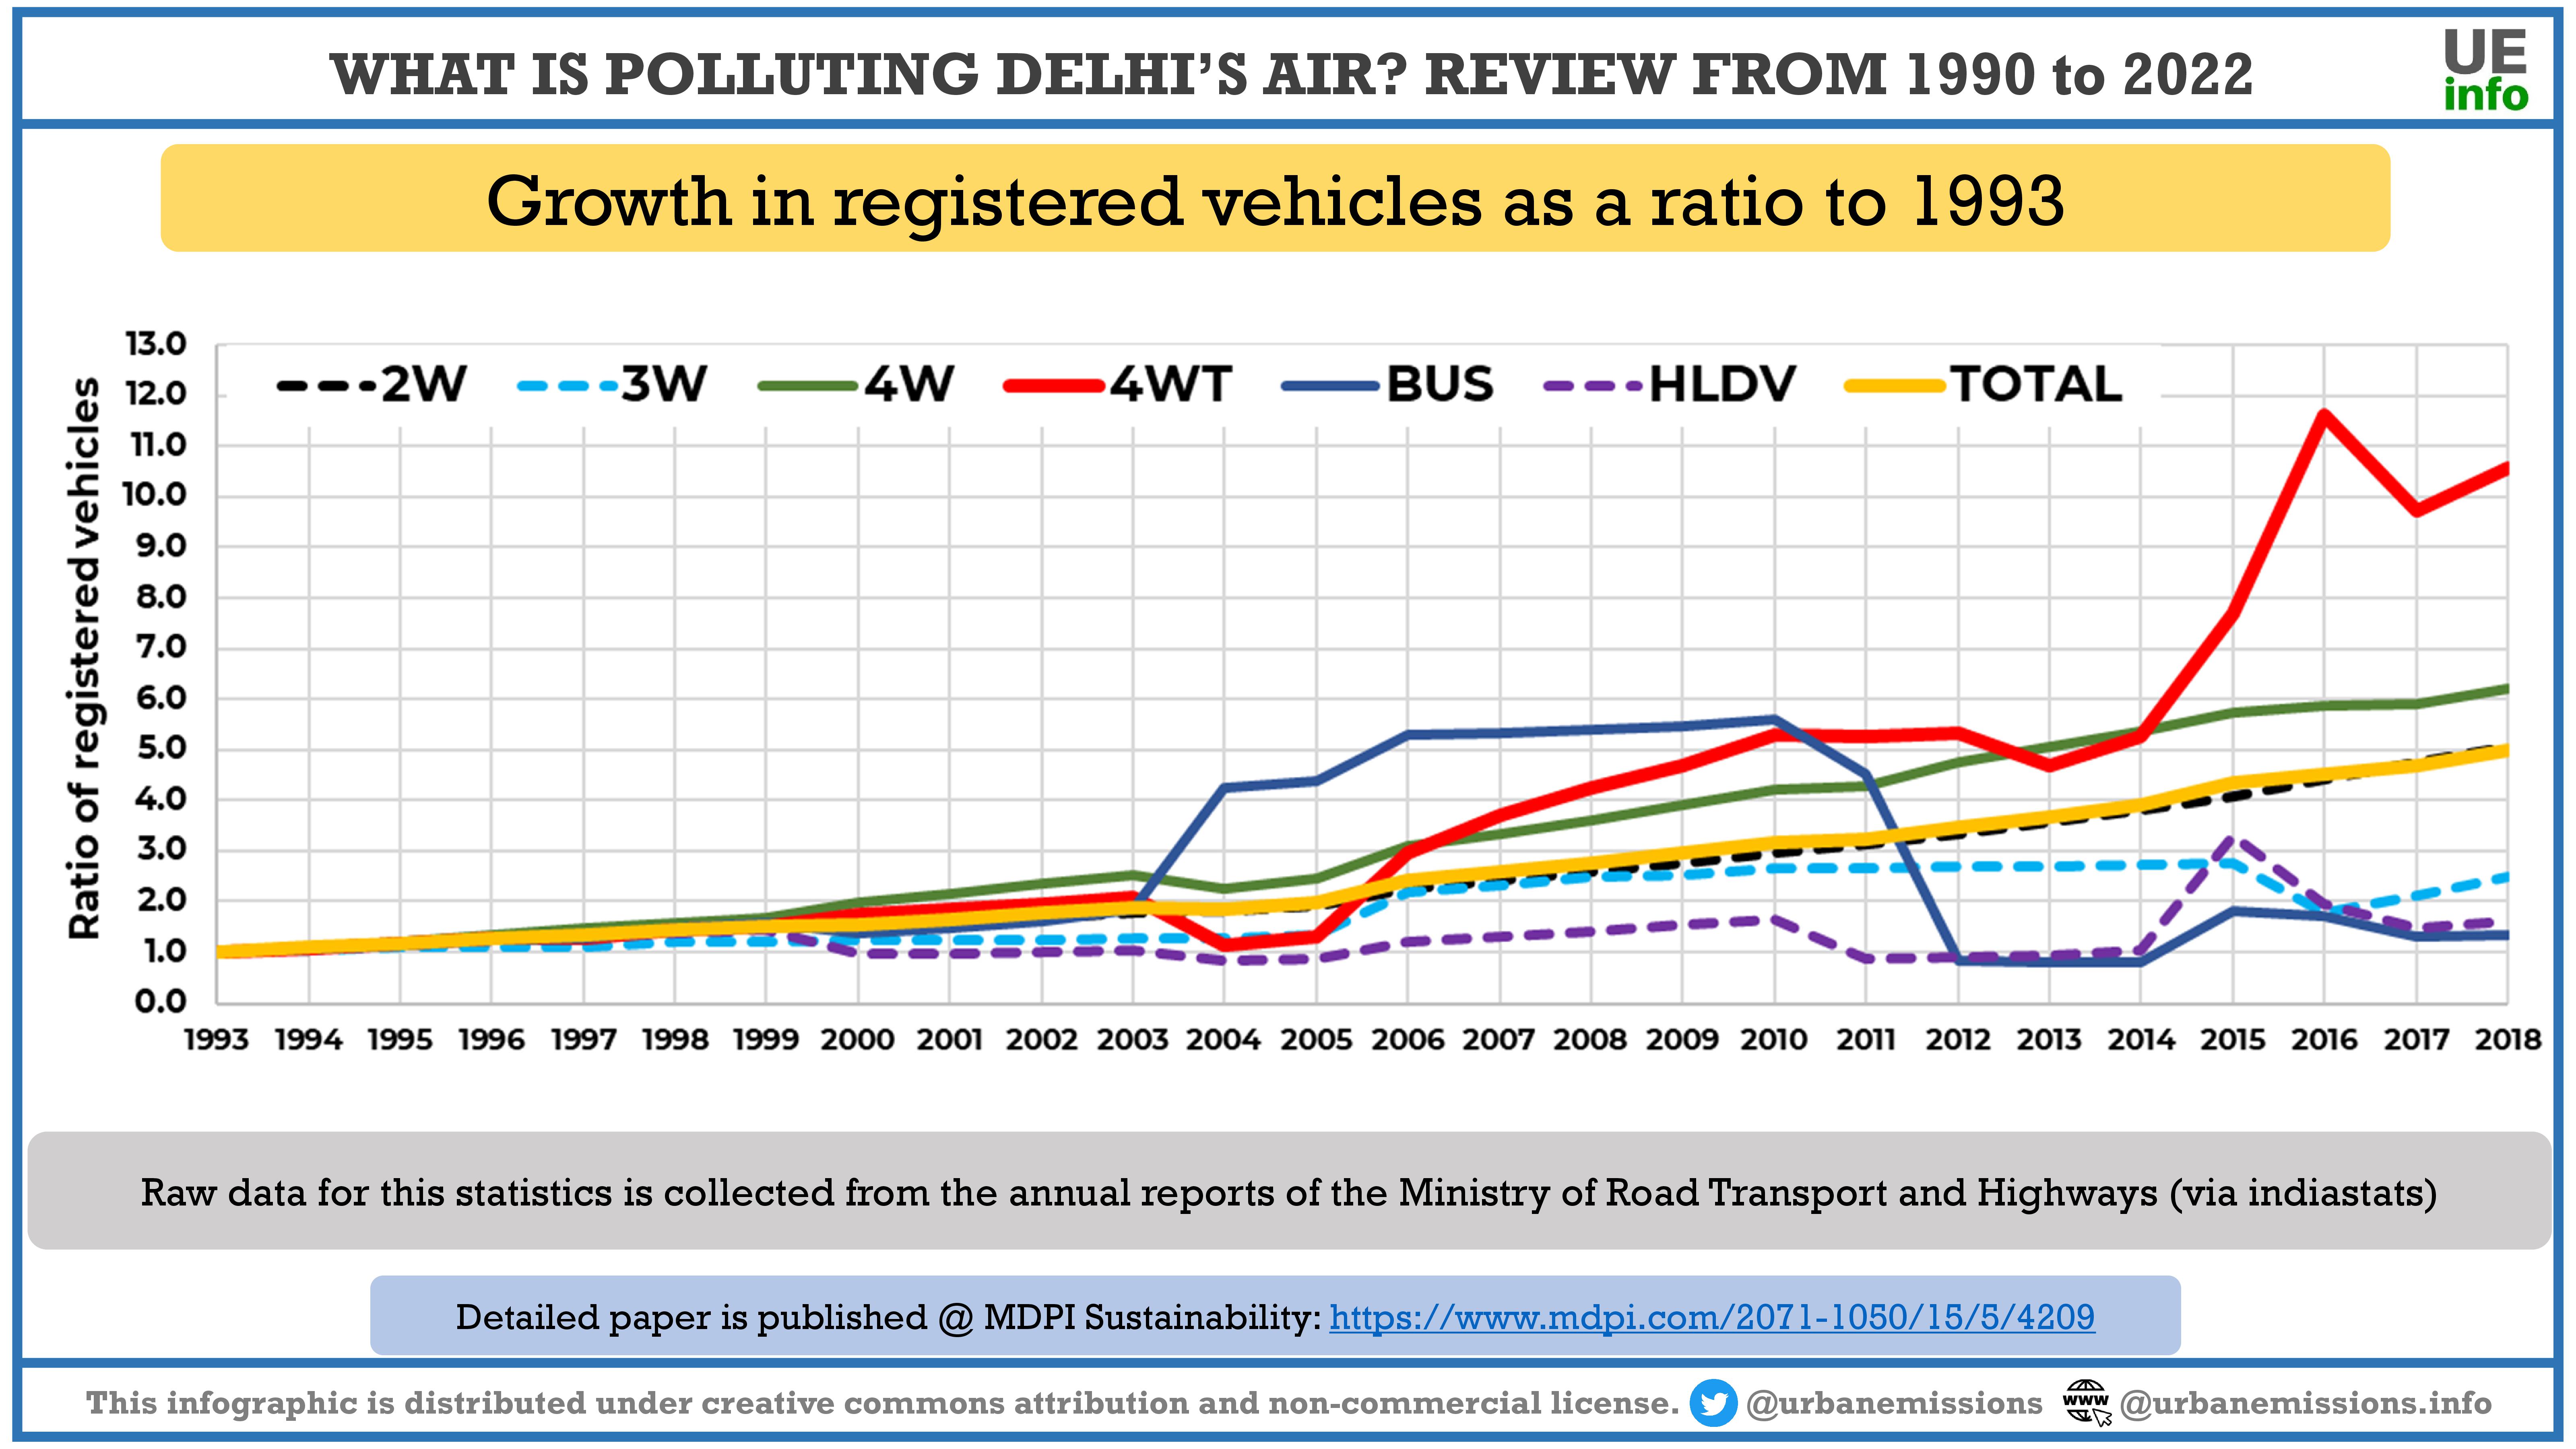
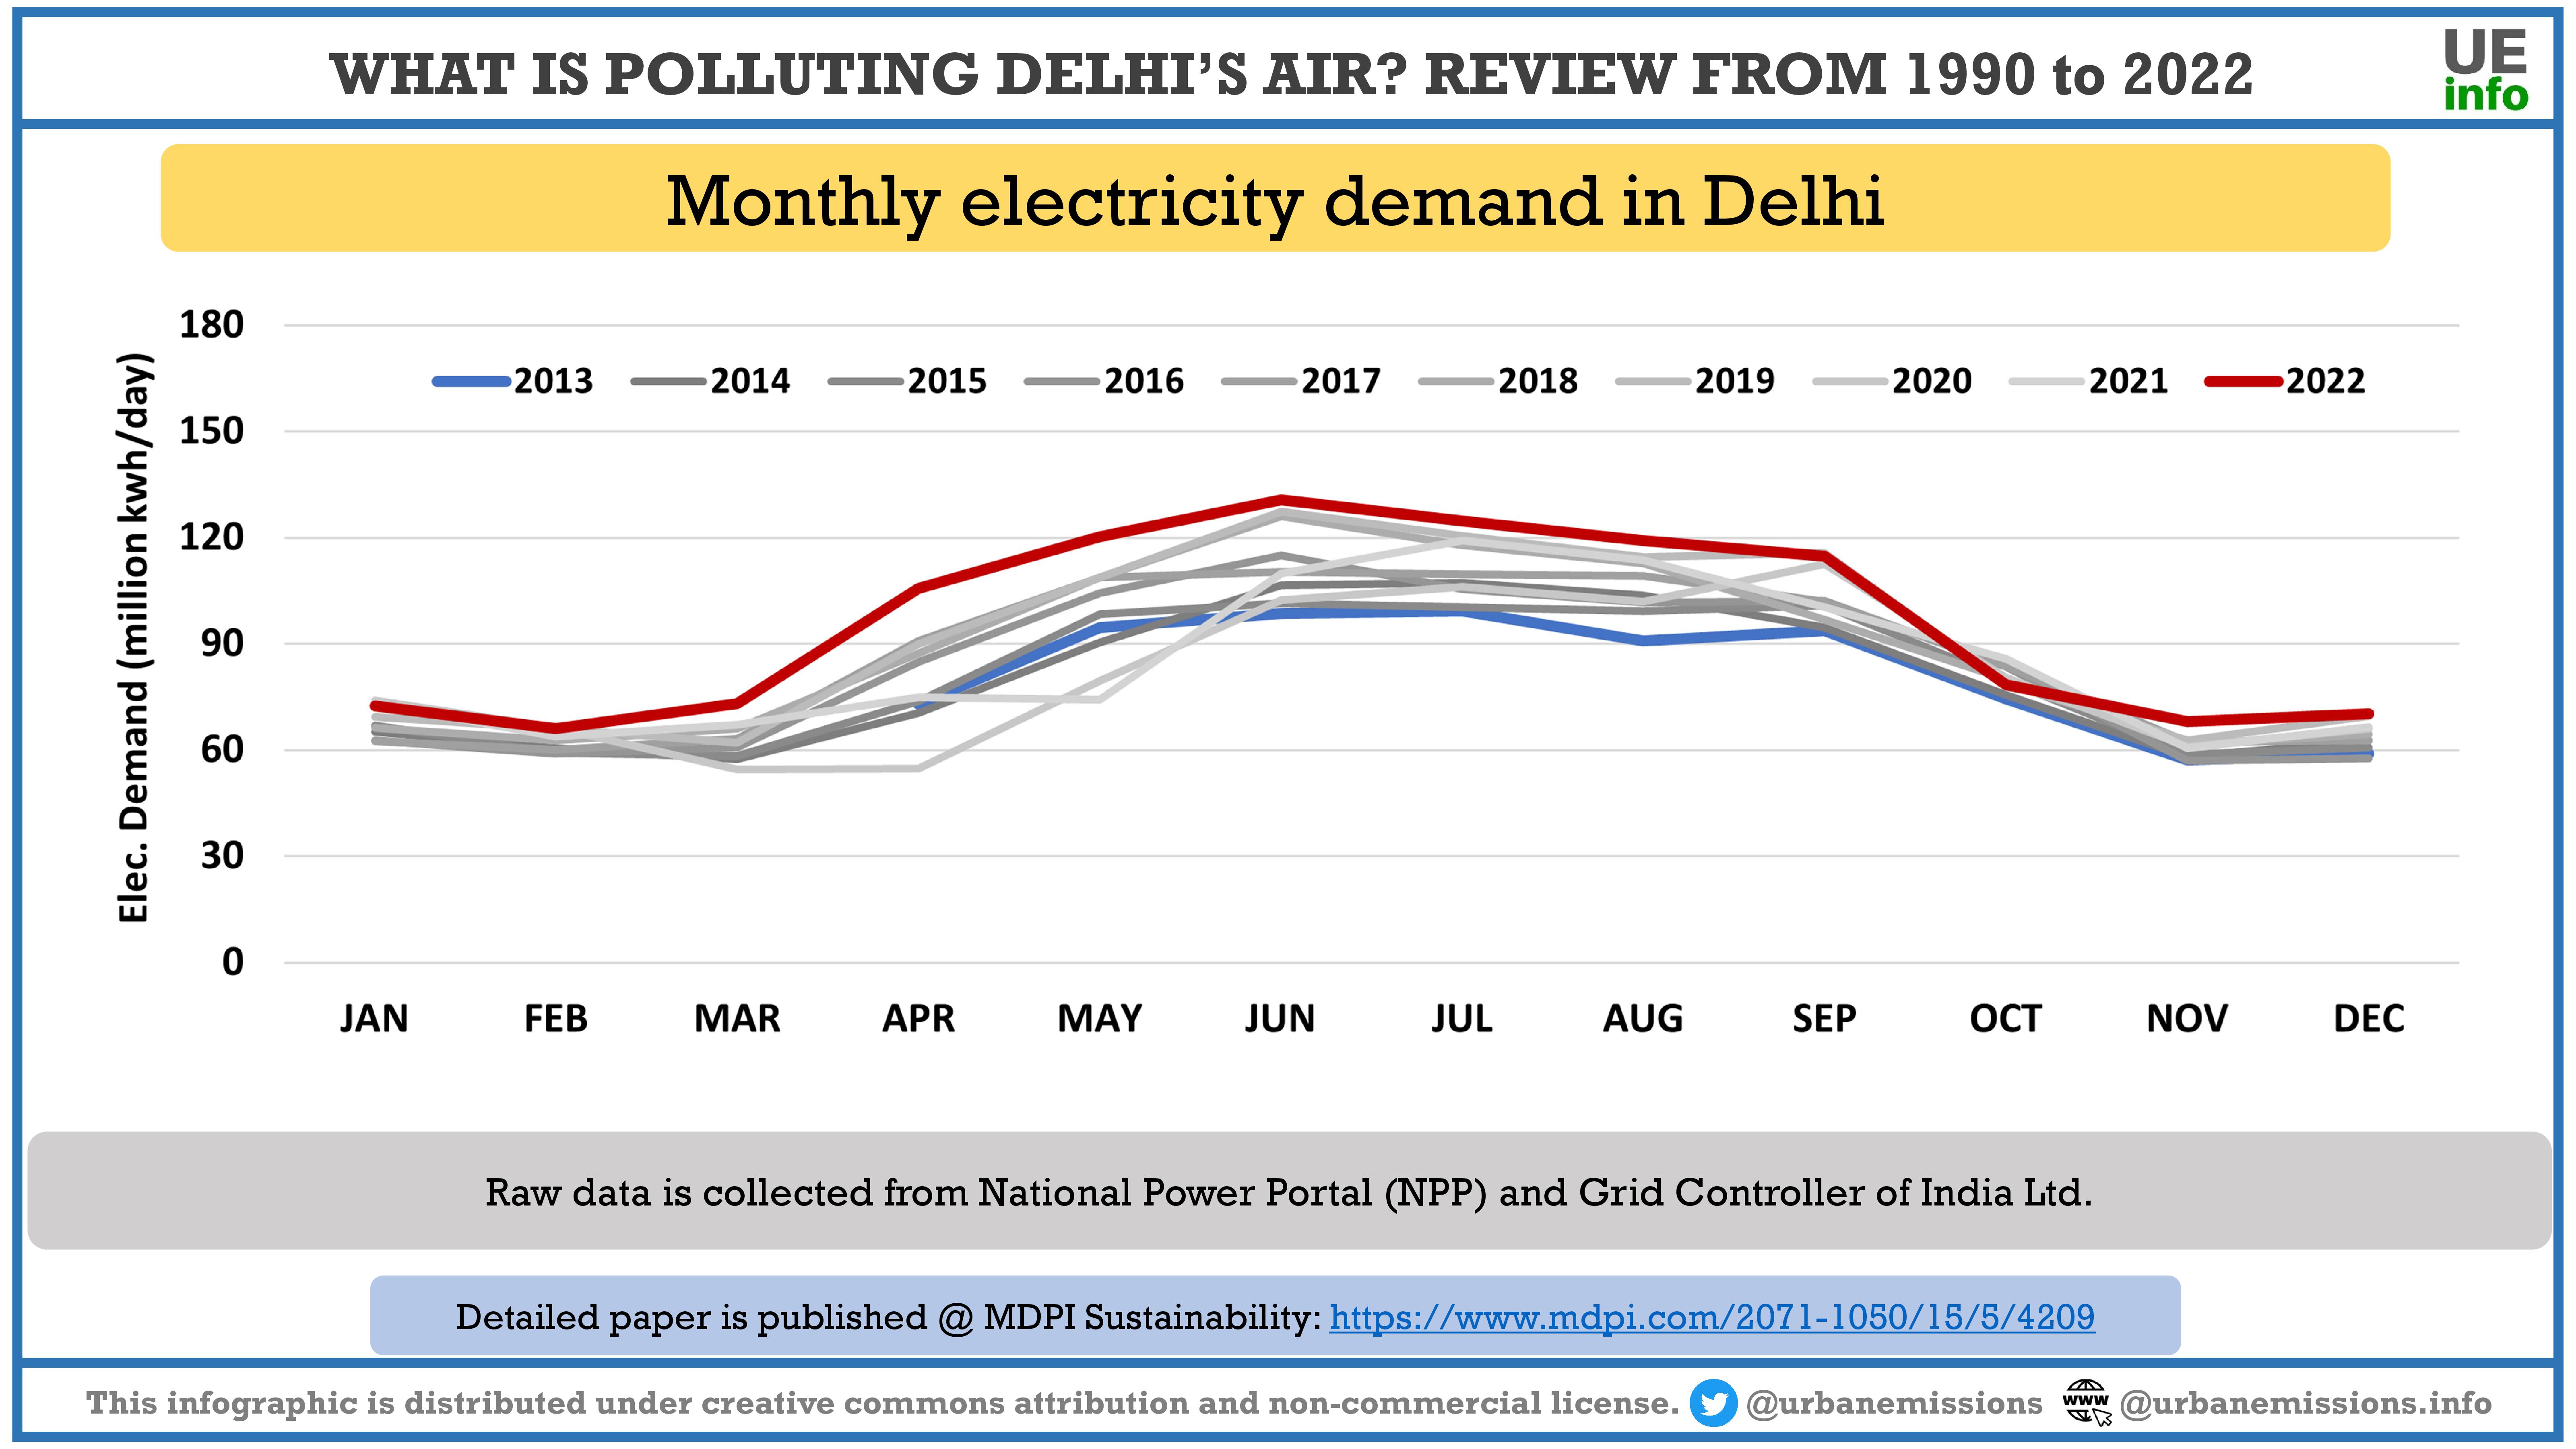
- Sectoral history of road transport, agricultural waste burning, residential (cooking and heating) emissions, open waste burning, construction sector (including brick kilns), road dust, power generation and demand, and Diwali fireworks
- Judicial and institutional engagement
All the data used for these graphs and in the journal article is available here – https://doi.org/10.5281/zenodo.7595760. The databases and the documents uploaded here are the following
- Available ambient air quality monitoring data for Delhi
- cpcb_delhi_data_2006-2018-raw-cleaned.rar – This is CPCB data from 2006 to 2018 as raw and cleaned files. Raw data is at 15 min internals, which needs some qa/qc checks before use. The cleaned data is hourly. For data cleaning, all null points, all negative points, integer values equal to 9999, 999, 1985, 985, 915, 515, 1200, 1000, 2000, 380, 3800, 675, and 718 were excluded. These values were recognized after searching the raw data for patterns. Instances of sudden jumps, which occur due to malfunctioning of instruments were recognized using running means [download]
- 1999-2006-CPCB ITO-Hourly.xlsx – This is hourly data from the ITO station only [download]
- NAMP data for 2011 to 2015 is hosted here – https://doi.org/10.5281/zenodo.6925200
- Graph-Composite-1989-2022.xlsx — This is a composite of all the annual average data along with the worksheet to make the image journal article’s graphical abstract and the infograph below [download]
- Support documents
- 1997-CPCB-White-Paper-on-Delhi-Air-Pollution.pdf [download]
- 2011-CPCB-Source-Apportionment-Report-Extracts.pdf [download]
- 2015-04 Infograph Delhi Banning Vehicles to Control AP.jpg [download]
- 2016-03 Inforgraph Delhi Odd Even Emissions.jpg [download]
- 2019-09-Infograph-Delhi-Odd-Even-Buses.jpg [download]
- 2020-NCAP-Planned-Source-Apportionment-studies.pdf [download]
- SIM-41-2021-Data-Resources-for-Energy-Emissions-Analysis.pdf [download]. Updated resource links are available here.
- Reanalysis fields from WUSTL (V3 — check main data link for updates)
- Satellite data extracts
A summary of these data included in the journal article is illustrated in the following infographics. Click on the images to enlarge to a higher resolution image. Download all the infographs as a PDF here.
 |
 |
 |
 |
 |
 |
 |
 |
 |
 |
 |
 |
Some opinion pieces published online are the following
- Come deepavali, it’s the explosion of hot air around pollution that hurts (link)
- How do we improve Delhi’s graded responsibility action plan for better air quality (link)
- A sense of Déjà Vu – How Delhi knew what to do to fix its air pollution in 1997 (link)
- What it means to taking the long view on air pollution in Delhi (link)
- Why Delhi’s plan for air filters at traffic intersections is a red herring (link)
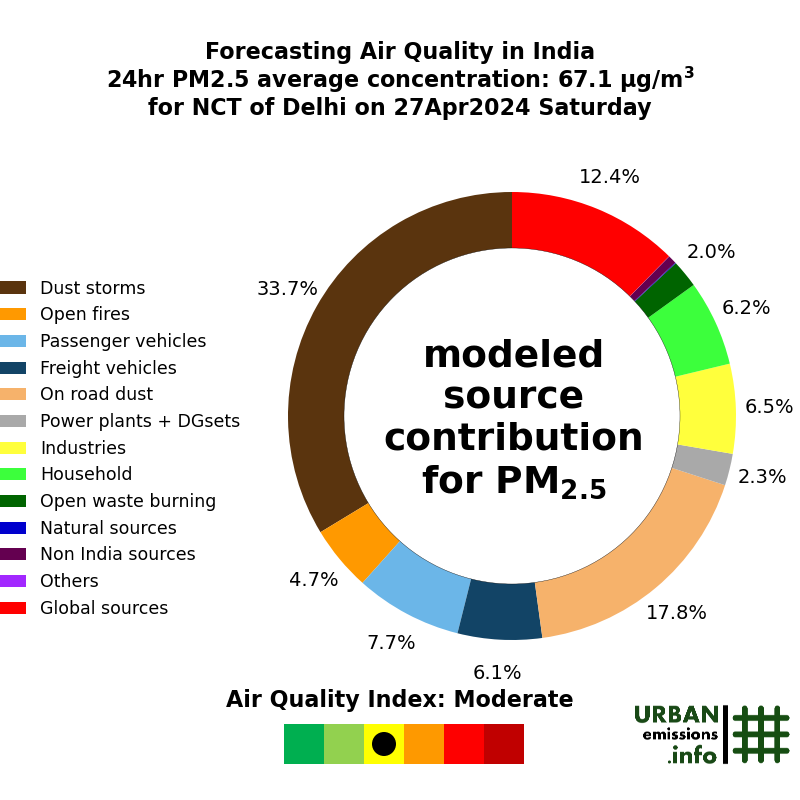
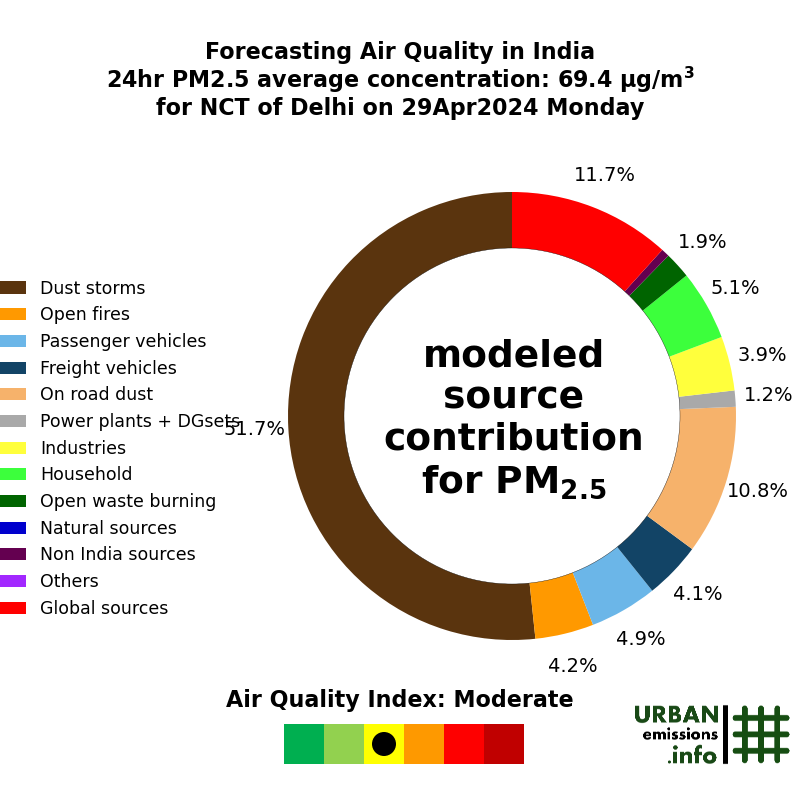
Air Quality Forecasts for Delhi
An updated inventory is currently in use to model air quality forecasts over the National Capital Region; including particulate source apportionment on an hourly basis (updated everyday at 8PM, IST).
 |
 |
 |
 |
 |
 |
 |
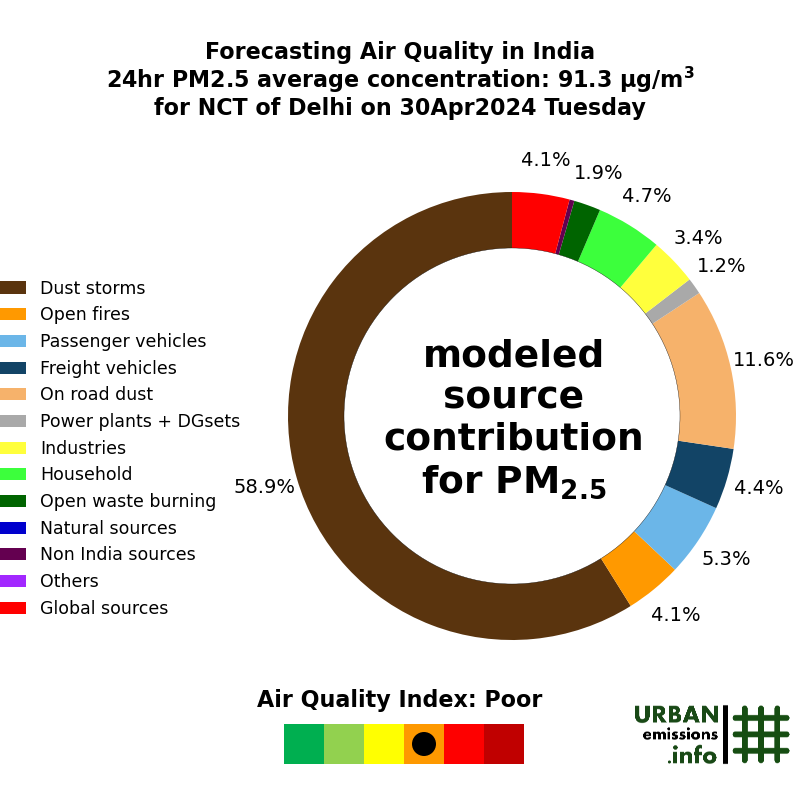 |
So, can we quantify polluting sources in Delhi?
This is not an easy question to answer, but the fact remains that we have an idea based on these ambient sampling and dispersion modelling based studies conducted in Delhi since 1990, and all of them point to same ranges of contributions summarized in this review journal article and in the infographic below.
A review of source apportionment methods is available here.
Resource material
-
- Delhi Air Quality Information
- Delhi Dialogue Commission
- Indian Institute of Tropical Meteorology, SAFAR program for Delhi
- Delhi Pollution Control Committee
- Nature of air pollution and emission sources in Indian cities (Atmospheric Environment, 2014)
- Health impacts of air pollution in Delhi (Environmental Development, 2013)
- A GIS based emissions inventory for Delhi (Atmospheric Environment, 2013)
- Critical review of receptor modeling in India (Atmospheric Environment, 2012)
- Particulate pollution source apportionment (CPCB, 2010)
- A call for open air pollution information (UEinfo, 2016)
- What’s eating Delhi’s air quality – emissions or meteorology?
- Why do we need to model air pollution?
- Benefits of restricting private vehicle usage
- How many buses are needed to support Delhi’s public transport?
- Evolution of the on-road transport emissions in Delhi
- Benefits of banning older vehicles on Delhi’s air quality