 Air quality, emissions, and source contributions analysis for the Greater Bengaluru region of India
Journal article in Atmospheric Pollution Research (2019) Download
[Repository of air quality information for this region is here]
[Handout – Overview of air quality management in Bengaluru]
[Infograph – Overview of air quality in Bengaluru – PDF]
[Infograph – Overview of meteorology in Bengaluru – PDF]
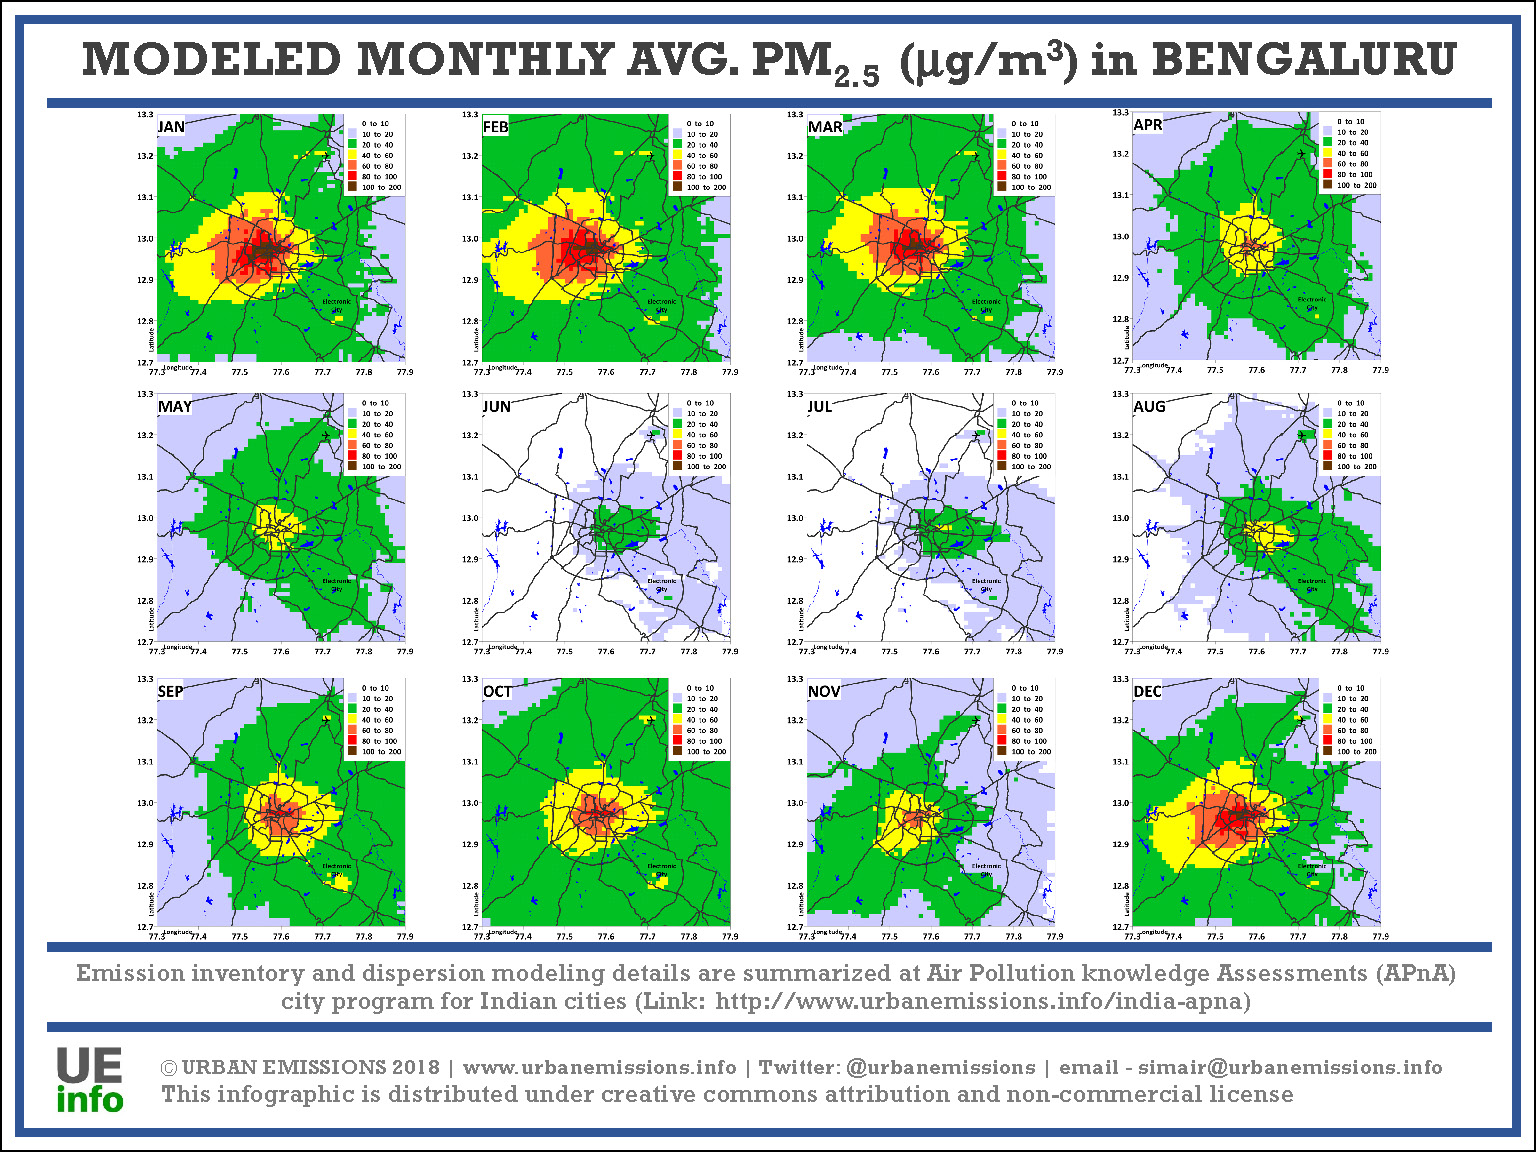
[Infograph – Overview of average monthly PM2.5 pollution across Bengaluru – PDF]
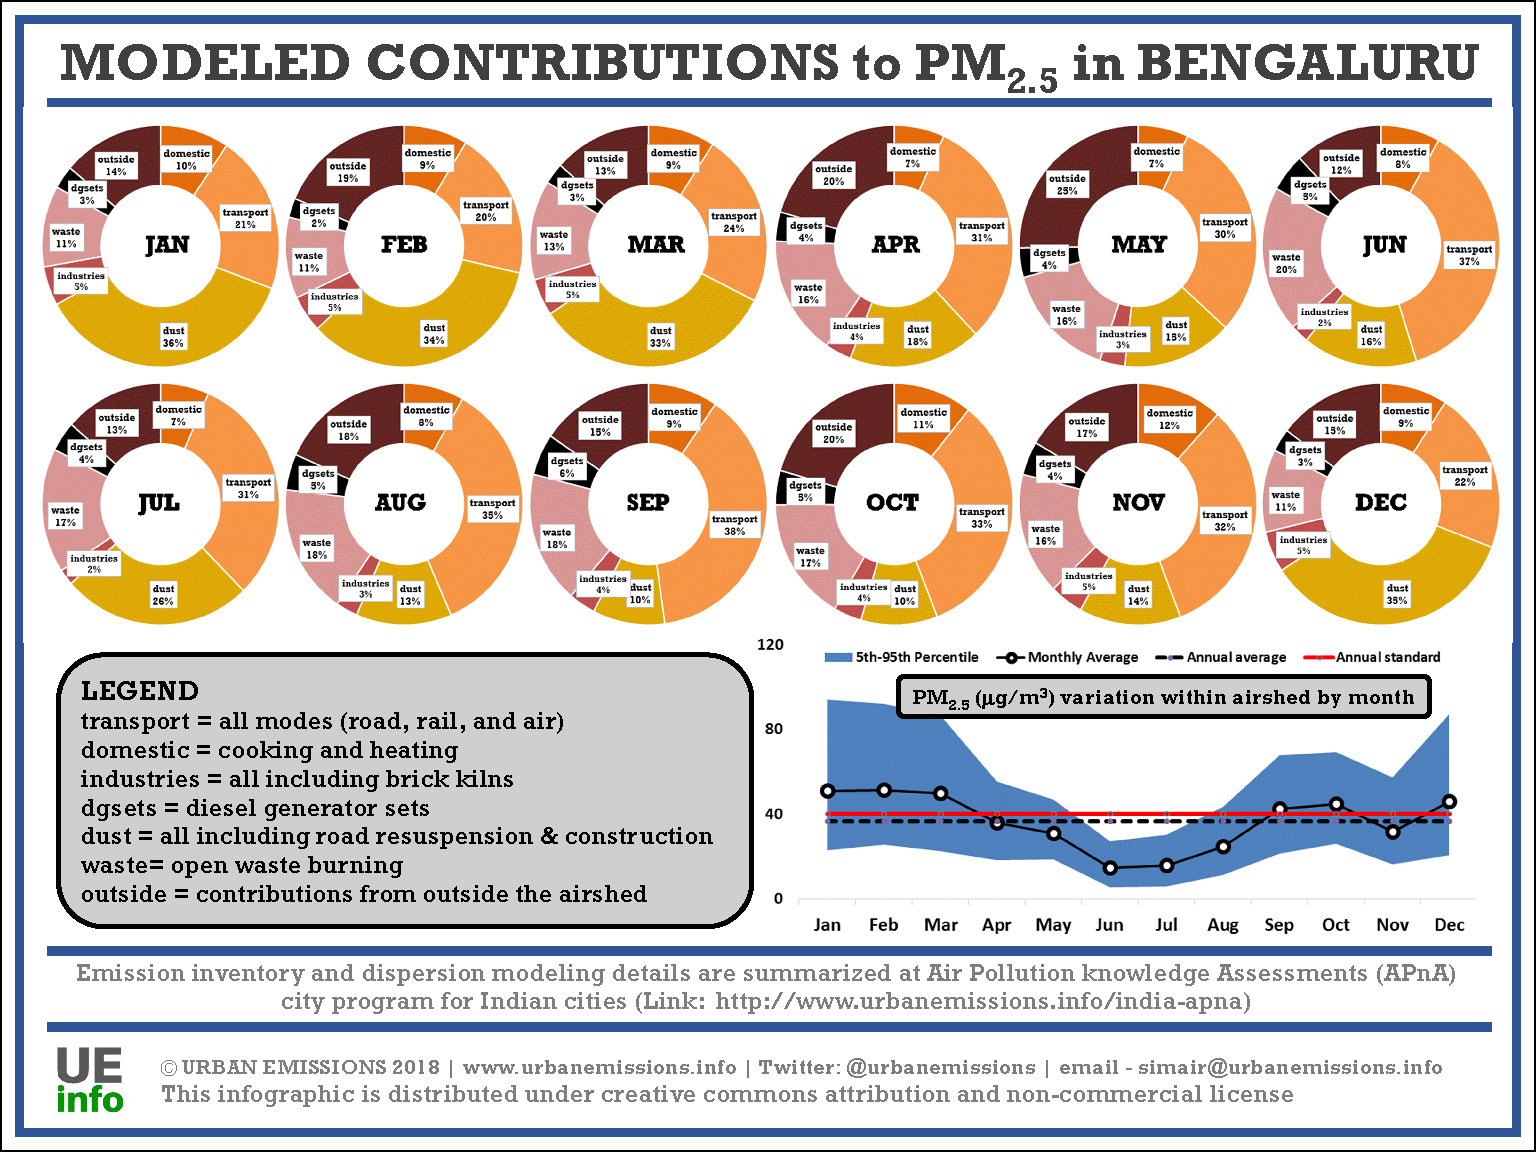
[Infograph – Overview of monthly source contributions to PM2.5 pollution in Bengaluru – PDF]
[Op-Ed in Citizen Matters on Bengaluru’s air quality monitoring needs (2018)]
****
Bengaluru (formerly Bangalore), the capital of Karnataka was a pioneer in that it was one of the first information technology (IT) hubs of India. What was once a laid-back retiree town is now a bustling metropolis with a population of 8.4 million. Population grew exponentially from the mid-eighties onwards with several companies establishing base in the city. The Greater Bengaluru Municipal Corporation is in charge of the city civic administration, was formed in 2007 by merging 100 wards of the erstwhile Bangalore Mahanagara Palike, with seven neighboring city municipal councils, one town municipal council and 110 villages around Bangalore.
Bangalore’s rapid growth, mostly associated with the growth of IT industry, has created problems relating to traffic congestion. The unplanned nature of growth in the city boosted the infrastructure and other construction activities in the region, and also resulted in massive traffic gridlocks that the municipality attempted to ease by constructing a flyover system and by imposing one-way traffic systems, which were unable to adequately address the on-road issues and associated increase in air pollution. Construction of housing for its growing population is another cause of air pollution in the form of resuspended dust. As the demand for housing has grown, the city finds itself spreading beyond its erstwhile boundaries to accommodate it.
To assess Bengaluru’s air quality, we selected 60km x 60km of urban airshed, which includes most of the industrial estates and brick kiln clusters in and around the city. This domain is further segregated into 1km grids, to study the spatial variations in the emission and the pollution loads.
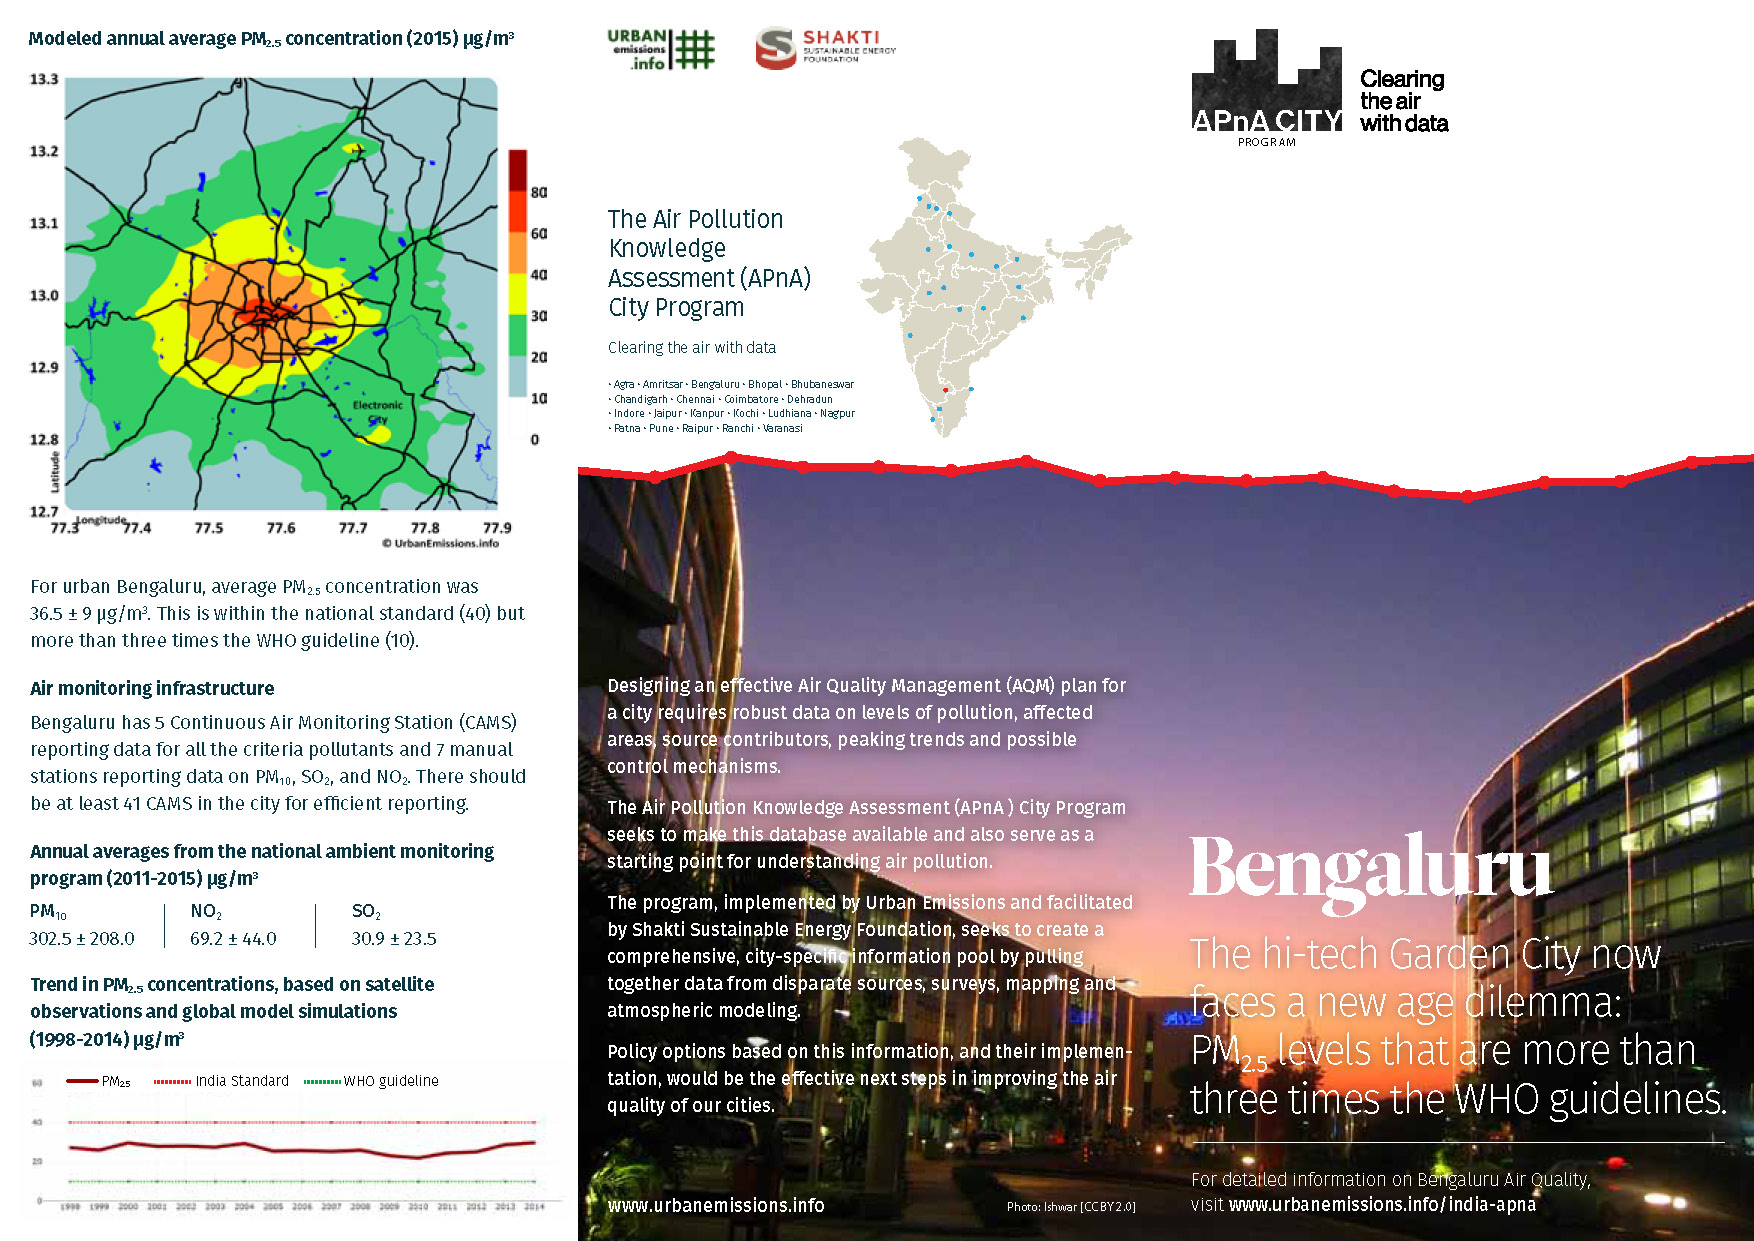
We present below a summary of the ambient monitoring data available under the National Ambient Monitoring Program (NAMP), operated and maintained by the Central Pollution Control Board (CPCB, New Delhi, India). In Bengaluru, there are 5 continuous monitoring station reporting data for all the criteria pollutants and 7 manual stations reporting data on PM10, SO2, and NO2.
Satellite Data Derived Surface PM2.5 Concentrations:
The results of satellite data derived concentrations are useful for evaluating annual trends in pollution levels and are not a proxy for on-ground monitoring networks. This data is estimated using satellite feeds and global chemical transport models. Satellites are not measuring one location all the time, instead, a combination of satellites provide a cache of measurements that are interpreted using global chemical transport models (GEOS-Chem) to represent the vertical mix of pollution and estimate ground-based concentrations with the help of previous ground-based measurements. The global transport models rely on gridded emission estimates for multiple sectors to establish a relationship with satellite observations over multiple years. These databases were also used to study the global burden of disease, which estimated air pollution as the top 10 causes of premature mortality and morbidity in India. A summary of PM2.5 concentrations from this exercise, for the city of Bengaluru is presented below. The global PM2.5 files are available for download and further analysis @ Dalhousie University.
We compiled an emissions inventory for the Bengaluru region for the following pollutants – sulfur dioxide (SO2), nitrogen oxides (NOx), carbon monoxide (CO), non-methane volatile organic compounds (NMVOCs), carbon dioxide (CO2); and particulate matter (PM) in four bins (a) coarse PM with size fraction between 2.5 and 10 μm (b) fine PM with size fraction less than 2.5 μm (c) black carbon (BC) and (d) organic carbon (OC), for year 2015 and projected to 2030.
We customized the SIM-air family of tools to fit the base information collated from the central pollution control board, state pollution control board, census bureau, national sample survey office, ministry of road transport and highways, annual survey of industries, central electrical authority, ministry of heavy industries, municipal waste management, geographical information systems, meteorological department, and publications from academic and non-governmental institutions.
This emissions inventory is based on the available local activity and fuel consumption estimates for the selected urban airshed (presented in the grid above) and does not include natural emission sources (like dust storms, lightning) and seasonal open (agricultural and forest) fires; which can only be included in a regional scale simulation. These emission sources are accounted in the concentration calculation as an external (also known as boundary or long-range) contribution to the city’s air quality.
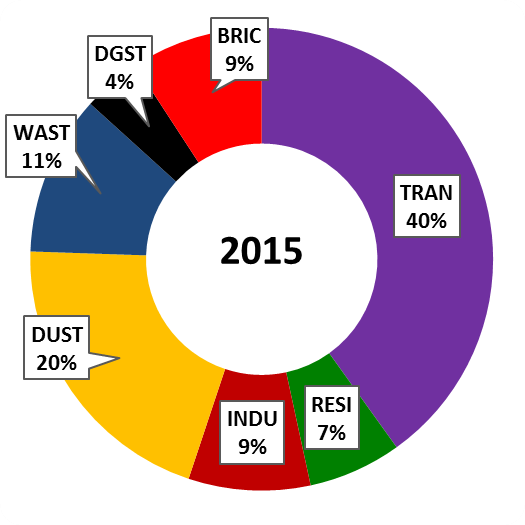
The emissions inventory was then spatially segregated at a 0.01° grid resolution in longitude and latitude (equivalent of 1 km) to create a spatial map of emissions for each pollutant (PM2.5, PM10, SO2, NOx, CO and VOCs). The gridded PM2.5 emissions and the total (shares by sector) emissions are presented below.
Gridded PM2.5 Emissions (2015)

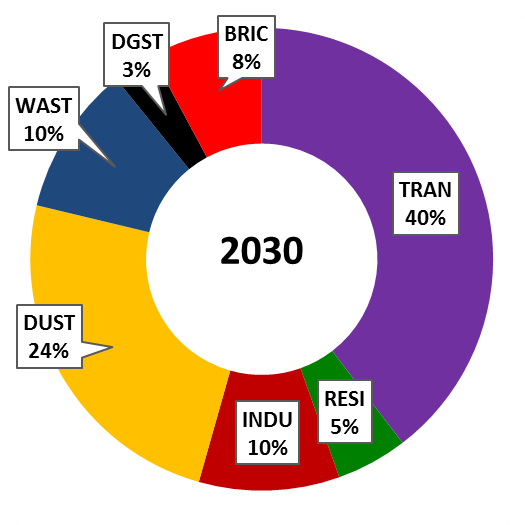
Total PM2.5 Emissions by Sector 2015-2030
 |
 |
 |
Total Estimated Emissions by Sector for 2015 (units – mil.tons/year for CO2 and tons/year for the rest)
| PM2.5 | PM10 | BC | OC | NOx | CO | VOC | SO2 | CO2 | |
|---|---|---|---|---|---|---|---|---|---|
| TRAN | 12,550 | 13,200 | 5,100 | 4,050 | 24,100 | 237,300 | 70,650 | 1,300 | 6.68 |
| RESI | 2,050 | 2,050 | 700 | 800 | 1,400 | 20,300 | 2,350 | 750 | 1.60 |
| INDU | 2,650 | 2,700 | 1,750 | 200 | 16,050 | 20,600 | 2,900 | 1,650 | 1.23 |
| DUST | 6,400 | 41,200 | - | - | - | - | - | - | - |
| WAST | 3,500 | 3,700 | 250 | 2,100 | 100 | 16,800 | 3,400 | 100 | 0.02 |
| DGST | 1,250 | 1,350 | 750 | 250 | 11,950 | 3,150 | 300 | 100 | 0.54 |
| BRIC | 2,900 | 2,900 | 800 | 1,050 | 3,300 | 37,400 | 3,900 | 1,400 | 0.34 |
| 31,300 | 67,100 | 9,350 | 8,450 | 56,900 | 335,550 | 83,500 | 5,300 | 10.42 |
TRAN = transport emissions from road, rail, aviation, and shipping (for coastal cities); RESI = residential emissions from cooking, heating, and lighting activities; INDU = industrial emissions from small, medium, and heavy industries (including power generation); DUST = dust emissions from road re-suspension and construction activities; WAST = open waste burning emissions; DGST = diesel generator set emissions; BRIC = brick kiln emissions (not included in the industrial emissions)
We processed the NCEP Reanalysis global meteorological fields from 2010 to 2016 through the 3D-WRF meteorological model. A summary of the data for year 2015, averaged for the district of Bengaluru is presented below. Download the processed data which includes information on year, month, day, hour, precipitation (mm/hour), mixing height (m), temperature (C), wind speed (m/sec), and wind direction (degrees) – key parameters which determine the intensity of dispersion of emissions.
Dispersion Modeling
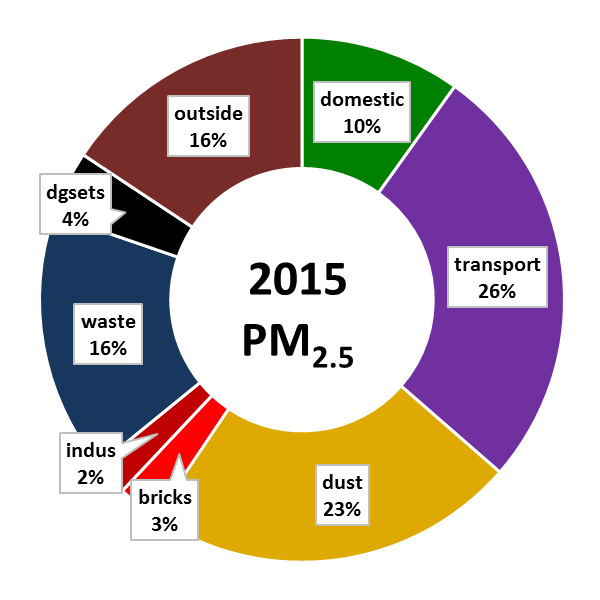
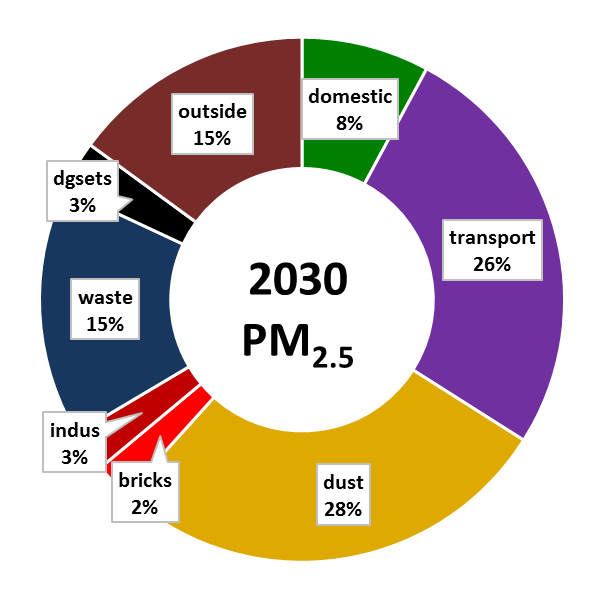
We calculated the ambient PM2.5 concentrations and the source contributions, using gridded emissions inventory, 3D meteorological data (from WRF), and the CAMx regional chemical transport model. The model simulates concentrations at 0.01° grid resolution and sector contributions to the urban area, which include contributions from primary emissions, secondary sources via chemical reactions, and long range transport via boundary conditions (represented as “outside” in the pie graph below).
 |
 |
 |
- Modeled urban average ambient PM2.5 concentration is 36.5 ± 9.0 μg/m3 – is under the national standard (40) and more than 3 times the WHO guideline (10)
- The city requires at least 41 continuous air monitoring stations to statistically, spatially, and temporally, represent the mix of sources and range of pollution in the city (current status – 7 manual and 5 continuous)
- The modeled source contributions highlight transport and open waste burning as the key sources in the urban areas
- The city has an estimated 16% of the ambient annual PM2.5 pollution (in 2015) originating outside the urban airshed, which suggests that some regional interventions could reduce the pollution loads
- The city needs to aggressively promote public and non-motorized transport as part of the city’s urban development plan, along with the improvement of the road infrastructure to reduce on-road dust re-suspension. The metro system is under construction and is expected to share the traffic loads on major roads
- By 2030, the vehicle exhaust emissions are expected to remain constant, if and only if, Bharat 6 fuel standards are introduced nationally in 2020, as recommended by the Auto Fuel Policy
- By 2030, the share of emissions from residential cooking and lighting is expected to decrease with a greater share of LPG, residential electrification, and increasing urbanization. However, biomass and coal burning to provide warmth in the winter will still be an issue
- About 500 brick kilns in this urban airshed are fueled mostly by coal and agri-waste. These are located to the east of the city and due to strong westerlies, throughout the year, their contribution to the urban areas is minimum. These kilns can benefit from a technology upgrade from the current fixed chimney to (for example) zig-zag, in order to improve their overall energy efficiency
- Open waste burning is dispersed across the city and requires stricter regulations for addressing the issue, as the city generates ever more garbage, with limited capacity to sort and dispose of it.
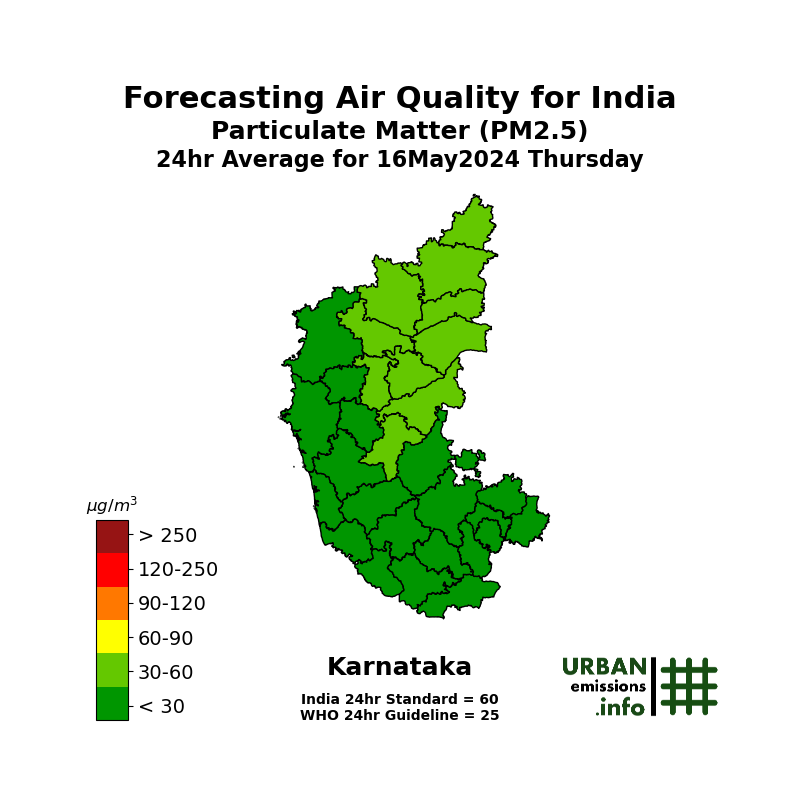
Modeled PM2.5 Forecasts for the state of Karanataka
 |
 |
 |
 |
Link to daily average concentration maps and source contribution assessments by state.
Link to hourly source contribution assessments by district.
Comparison of Modeled PM2.5 Forecasts and Measurements for Bengaluru (updated every 30 minutes)
Back to the APnA page.
All the analysis and results are sole responsibility of the authors @ UrbanEmissions.Info. Please send you comments and questions to simair@urbanemissions.info