 Chandigarh is in the unique position of being a union territory that serves as the capital for the states of Haryana (on the east) and Punjab (on the north, west and south). Chandigarh, located at the foothills of the Himalayas in northwest India, was one of the first planned cities in India and is known for its urban design, by Swiss architect Lr Corbusier. The Greater Chandigarh region includes Chandigarh, the city of Panchkula (in Haryana), and cities of Kharar, Kurali, Mohali, Zirakpur (in Punjab), with a combined population of about 2 million and one of the highest per capita incomes in India.
The three governments having their base here i.e. Chandigarh Administration, Punjab government and Haryana government, a significant percentage of Chandigarh’s population therefore consists of people who are either working for one of these governments or have retired from government service mainly Armed forces. For this reason, Chandigarh is often called a “Pensioner’s Paradise”. There are about 15 medium to large industries and over 2500 units registered under small-scale industry sector. They include paper manufacturing, basic metals and alloys and machinery. Other industries are relating to food products, sanitary ware, auto parts, machine tools, pharmaceuticals and electrical appliances.
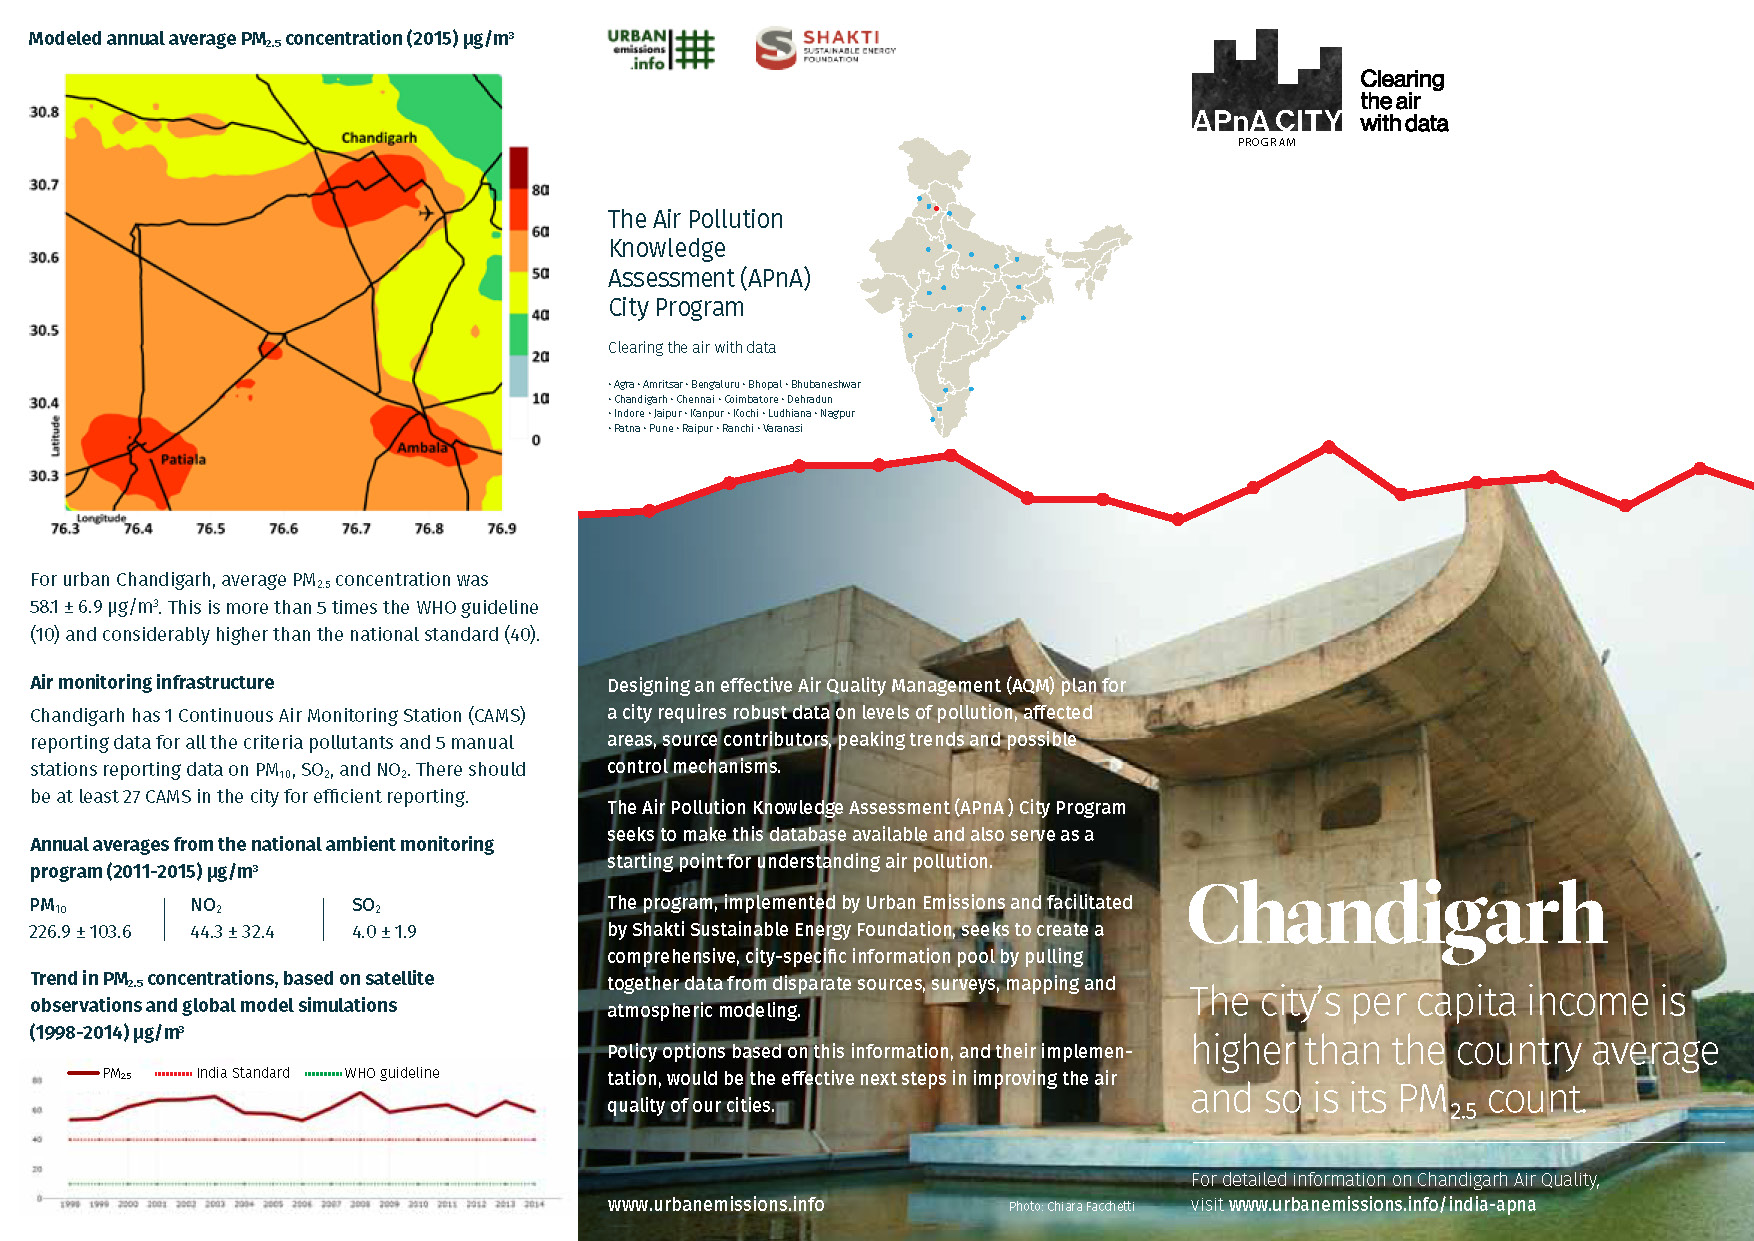
To assess Chandigarh’s air quality, we selected 60km x 60km domain, also including Patiala and Ambala, both in the South and less than 30km away from the city, with constant flow of passenger and freight movement between the three urban centers. This domain is further segregated into 1km grids, to study the spatial variations in the emission and the pollution loads.
We present below a summary of the ambient monitoring data available under the National Ambient Monitoring Program (NAMP), operated and maintained by the Central Pollution Control Board (CPCB, New Delhi, India). In Chandigarh, there is 1 continuous monitoring air station (CAMS) reporting data for all the criteria pollutants and 5 manual stations reporting data on PM10, SO2, and NO2.
Satellite Data Derived Surface PM2.5 Concentrations:
The results of satellite data derived concentrations are useful for evaluating annual trends in pollution levels and are not a proxy for on-ground monitoring networks. This data is estimated using satellite feeds and global chemical transport models. Satellites are not measuring one location all the time, instead, a combination of satellites provide a cache of measurements that are interpreted using global chemical transport models (GEOS-Chem) to represent the vertical mix of pollution and estimate ground-based concentrations with the help of previous ground-based measurements. The global transport models rely on gridded emission estimates for multiple sectors to establish a relationship with satellite observations over multiple years. These databases were also used to study the global burden of disease, which estimated air pollution as the top 10 causes of premature mortality and morbidity in India. A summary of PM2.5 concentrations from this exercise for Chandigarh is presented below. The global PM2.5 files are available for download and further analysis @ Dalhousie University.
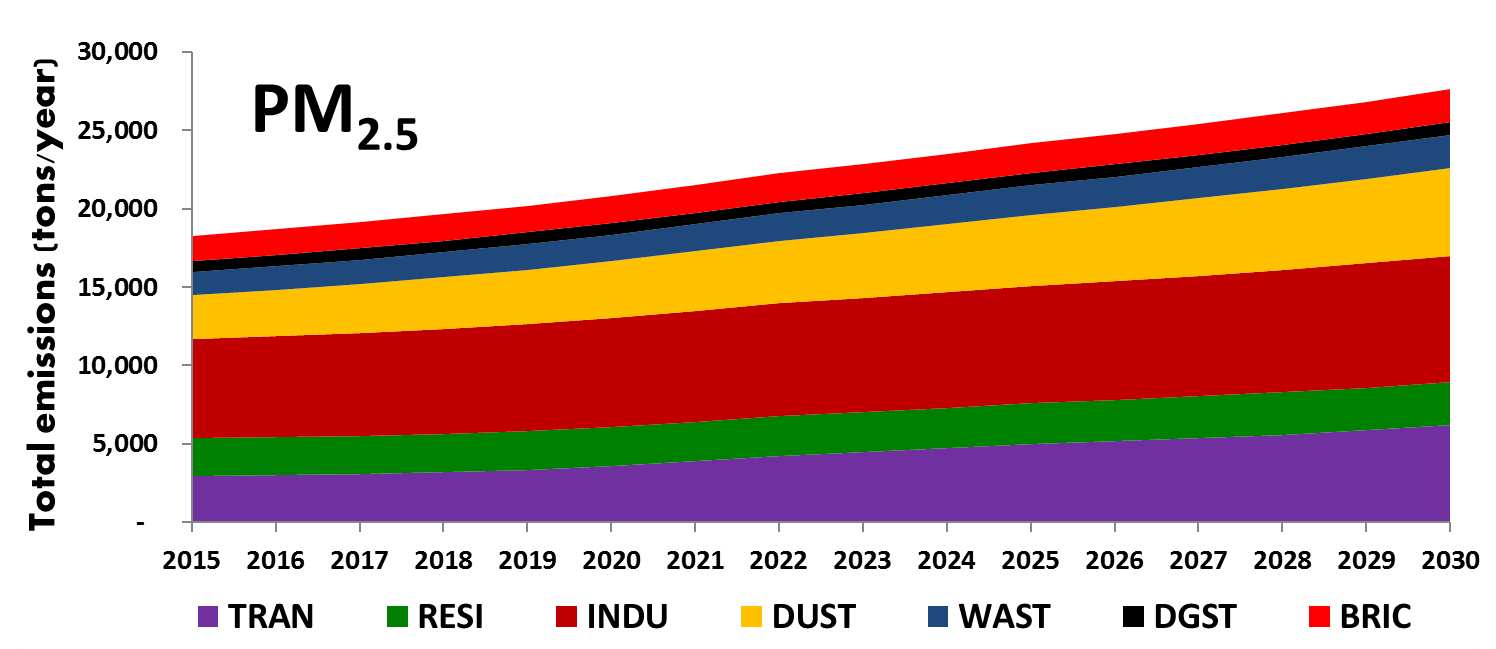
We compiled an emissions inventory for the chandigarh region for the following pollutants – sulfur dioxide (SO2), nitrogen oxides (NOx), carbon monoxide (CO), non-methane volatile organic compounds (NMVOCs), carbon dioxide (CO2); and particulate matter (PM) in four bins (a) coarse PM with size fraction between 2.5 and 10 μm (b) fine PM with size fraction less than 2.5 μm (c) black carbon (BC) and (d) organic carbon (OC), for year 2015 and projected to 2030.
We customized the SIM-air family of tools to fit the base information collated from the central pollution control board, state pollution control board, census bureau, national sample survey office, ministry of road transport and highways, annual survey of industries, central electrical authority, ministry of heavy industries, municipal waste management, geographical information systems, meteorological department, and publications from academic and non-governmental institutions.
This emissions inventory is based on the available local activity and fuel consumption estimates for the selected urban airshed (presented in the grid above) and does not include natural emission sources (like dust storms, lightning) and seasonal open (agricultural and forest) fires; which can only be included in a regional scale simulation. These emission sources are accounted in the concentration calculation as an external (also known as boundary or long-range) contribution to the city’s air quality.
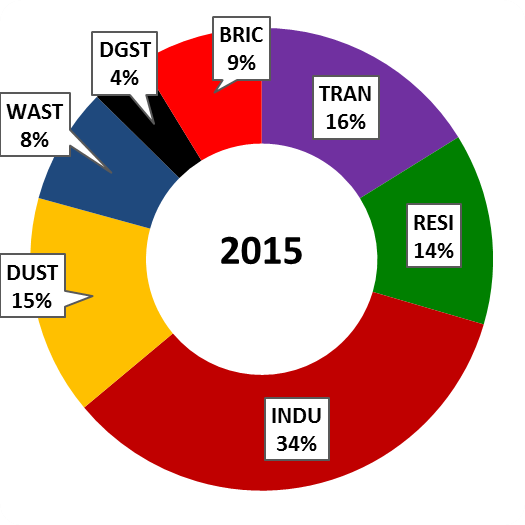
The emissions inventory was then spatially segregated at a 0.01° grid resolution in longitude and latitude (equivalent of 1 km) to create a spatial map of emissions for each pollutant (PM2.5, PM10, SO2, NOx, CO and VOCs). The gridded PM2.5 emissions and the total (shares by sector) emissions are presented below.
Gridded PM2.5 Emissions (2015)

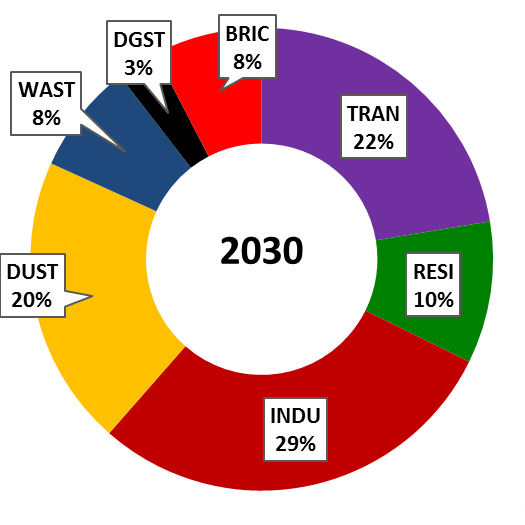
Total PM2.5 Emissions by Sector 2015-2030
 |
 |
 |
Total Estimated Emissions by Sector for 2015 (units – mil.tons/year for CO2 and tons/year for the rest)
| PM2.5 | PM10 | BC | OC | NOx | CO | VOC | SO2 | CO2 | |
|---|---|---|---|---|---|---|---|---|---|
| TRAN | 2,950 | 3,100 | 1,000 | 1,000 | 4,950 | 82,950 | 24,650 | 250 | 1.87 |
| RESI | 2,450 | 2,500 | 550 | 1,150 | 900 | 33,600 | 4,150 | 600 | 0.61 |
| INDU | 6,300 | 6,600 | 950 | 1,050 | 42,500 | 15,150 | 3,350 | 1,500 | 0.99 |
| DUST | 2,800 | 17,500 | - | - | - | - | - | - | - |
| WAST | 1,500 | 1,550 | 100 | 900 | 50 | 7,150 | 1,450 | 50 | 0.01 |
| DGST | 700 | 750 | 400 | 150 | 6,650 | 1,750 | 150 | 50 | 0.30 |
| BRIC | 1,600 | 1,600 | 450 | 600 | 1,250 | 19,750 | 2,100 | 750 | 0.14 |
| 18,300 | 33,600 | 3,450 | 4,850 | 56,300 | 160,350 | 35,850 | 3,200 | 3.91 |
TRAN = transport emissions from road, rail, aviation, and shipping (for coastal cities); RESI = residential emissions from cooking, heating, and lighting activities; INDU = industrial emissions from small, medium, and heavy industries (including power generation); DUST = dust emissions from road re-suspension and construction activities; WAST = open waste burning emissions; DGST = diesel generator set emissions; BRIC = brick kiln emissions (not included in the industrial emissions)
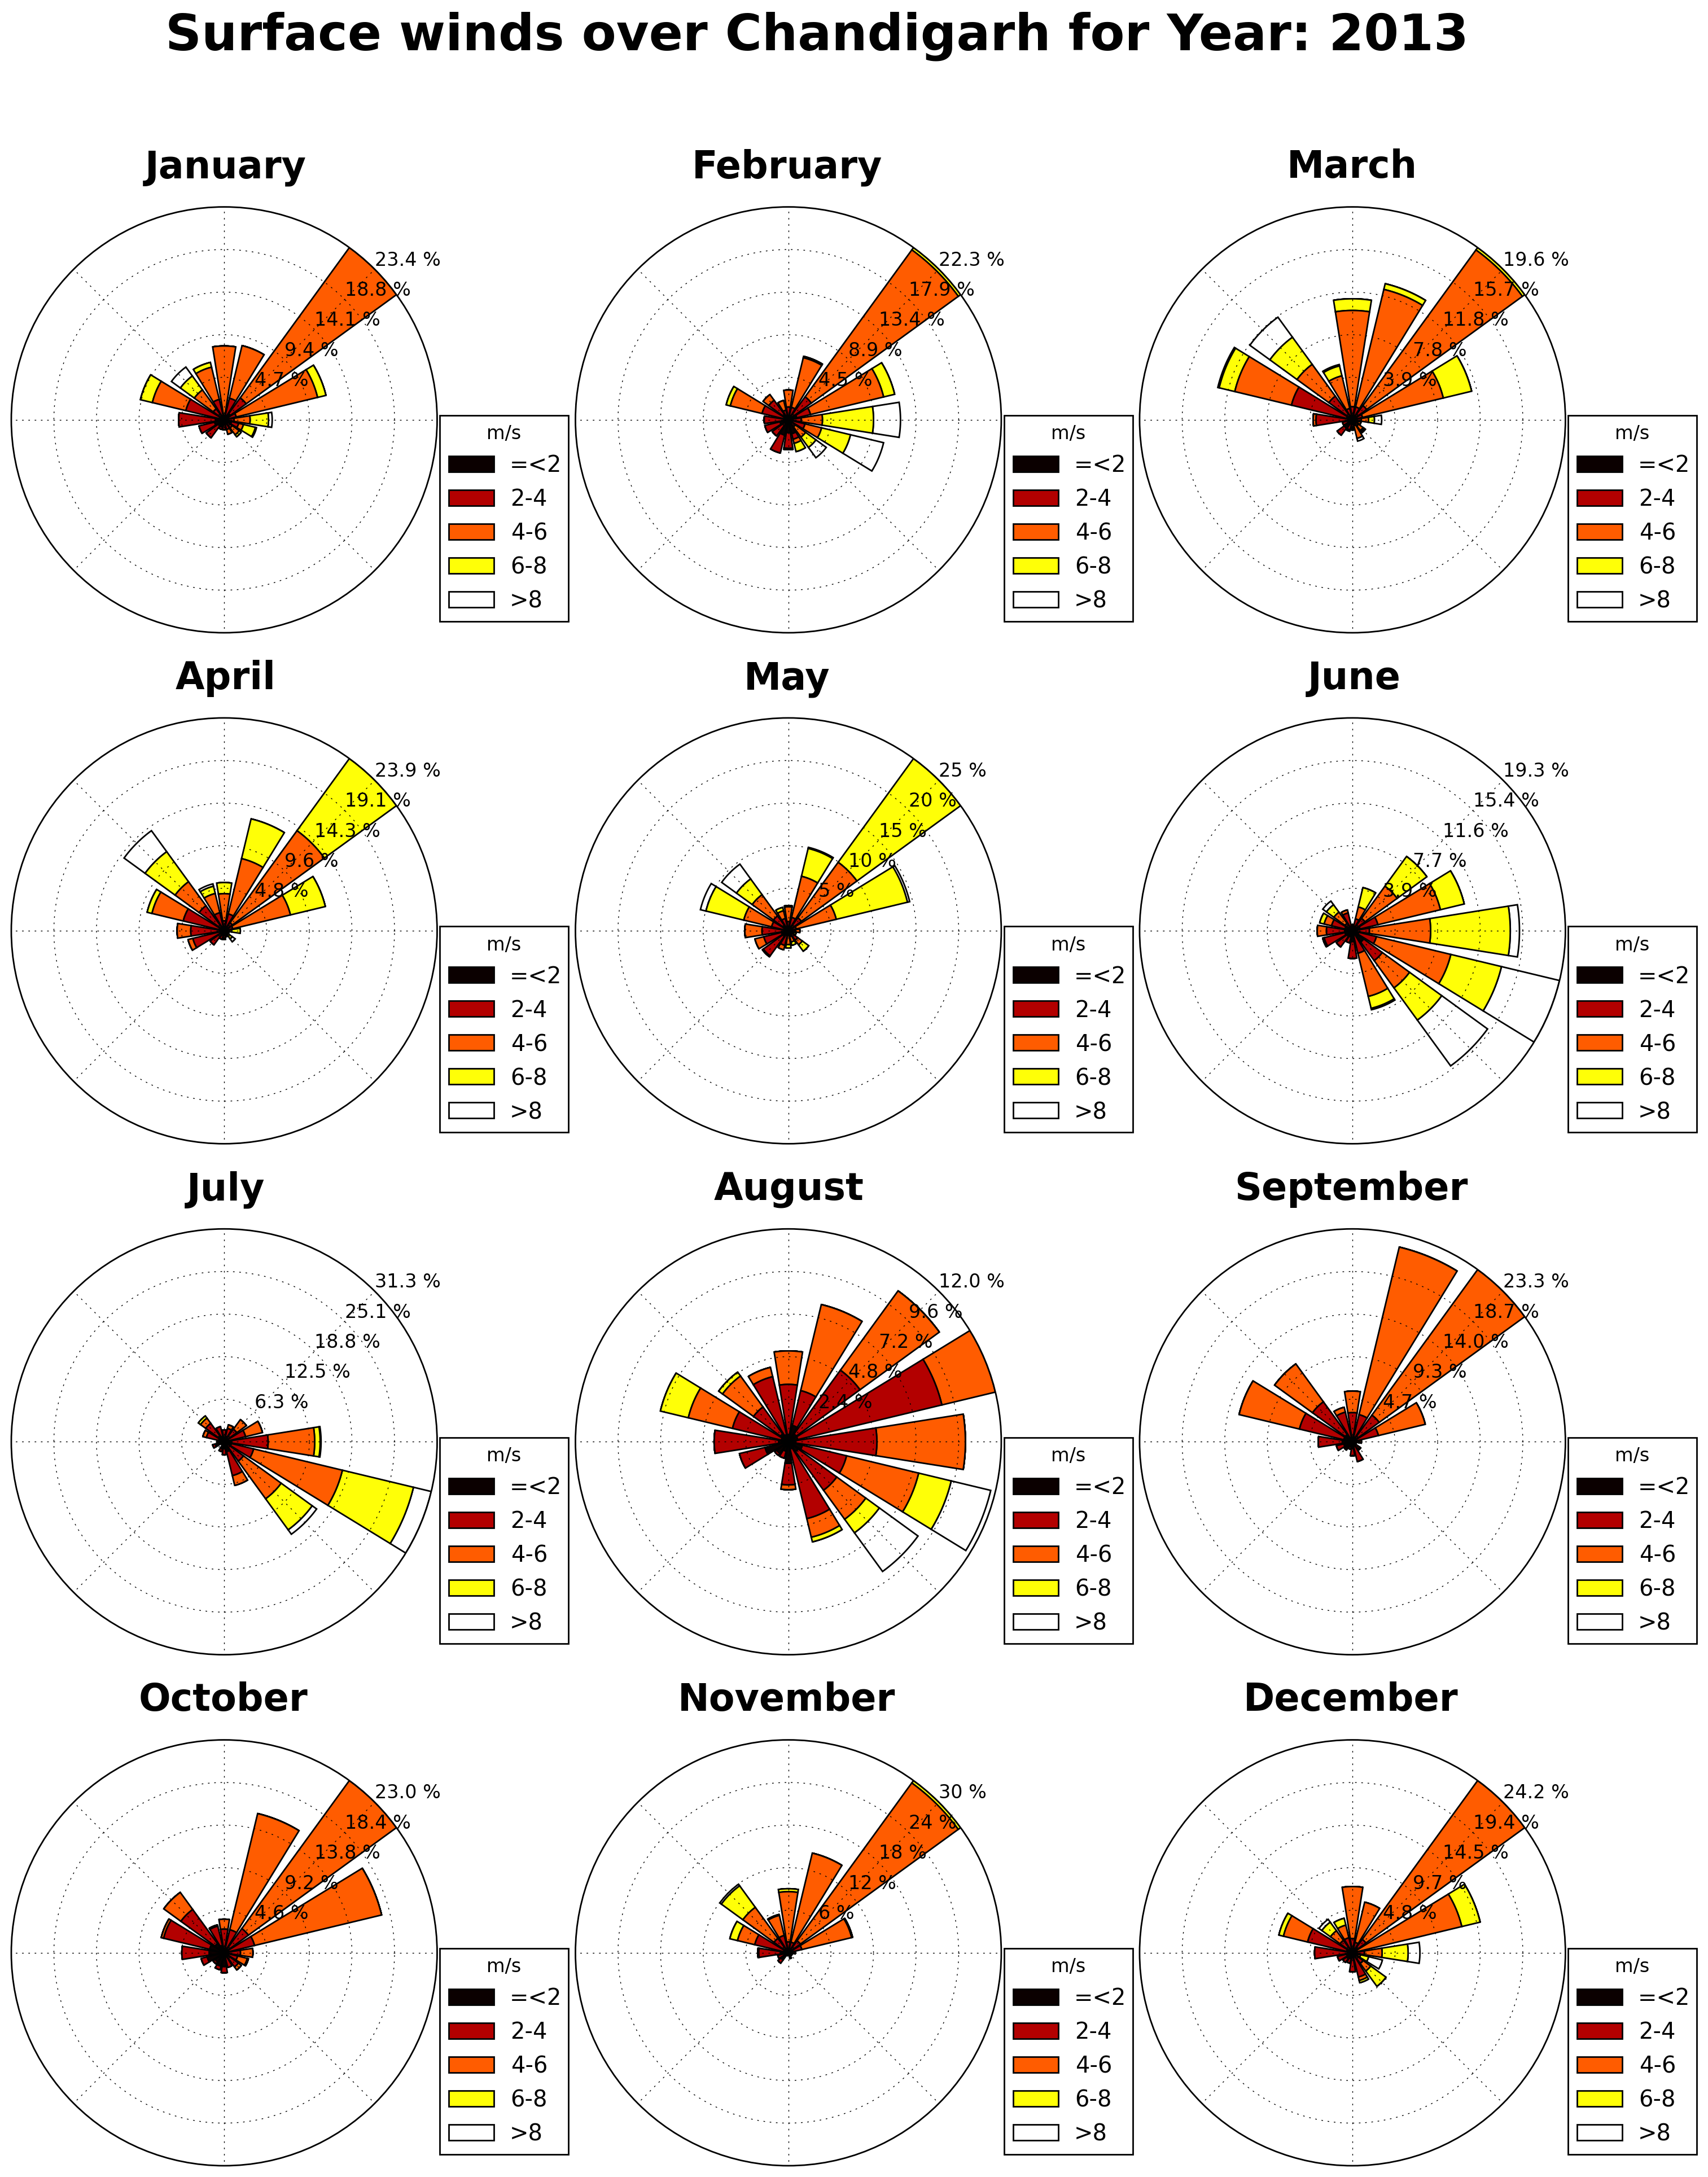
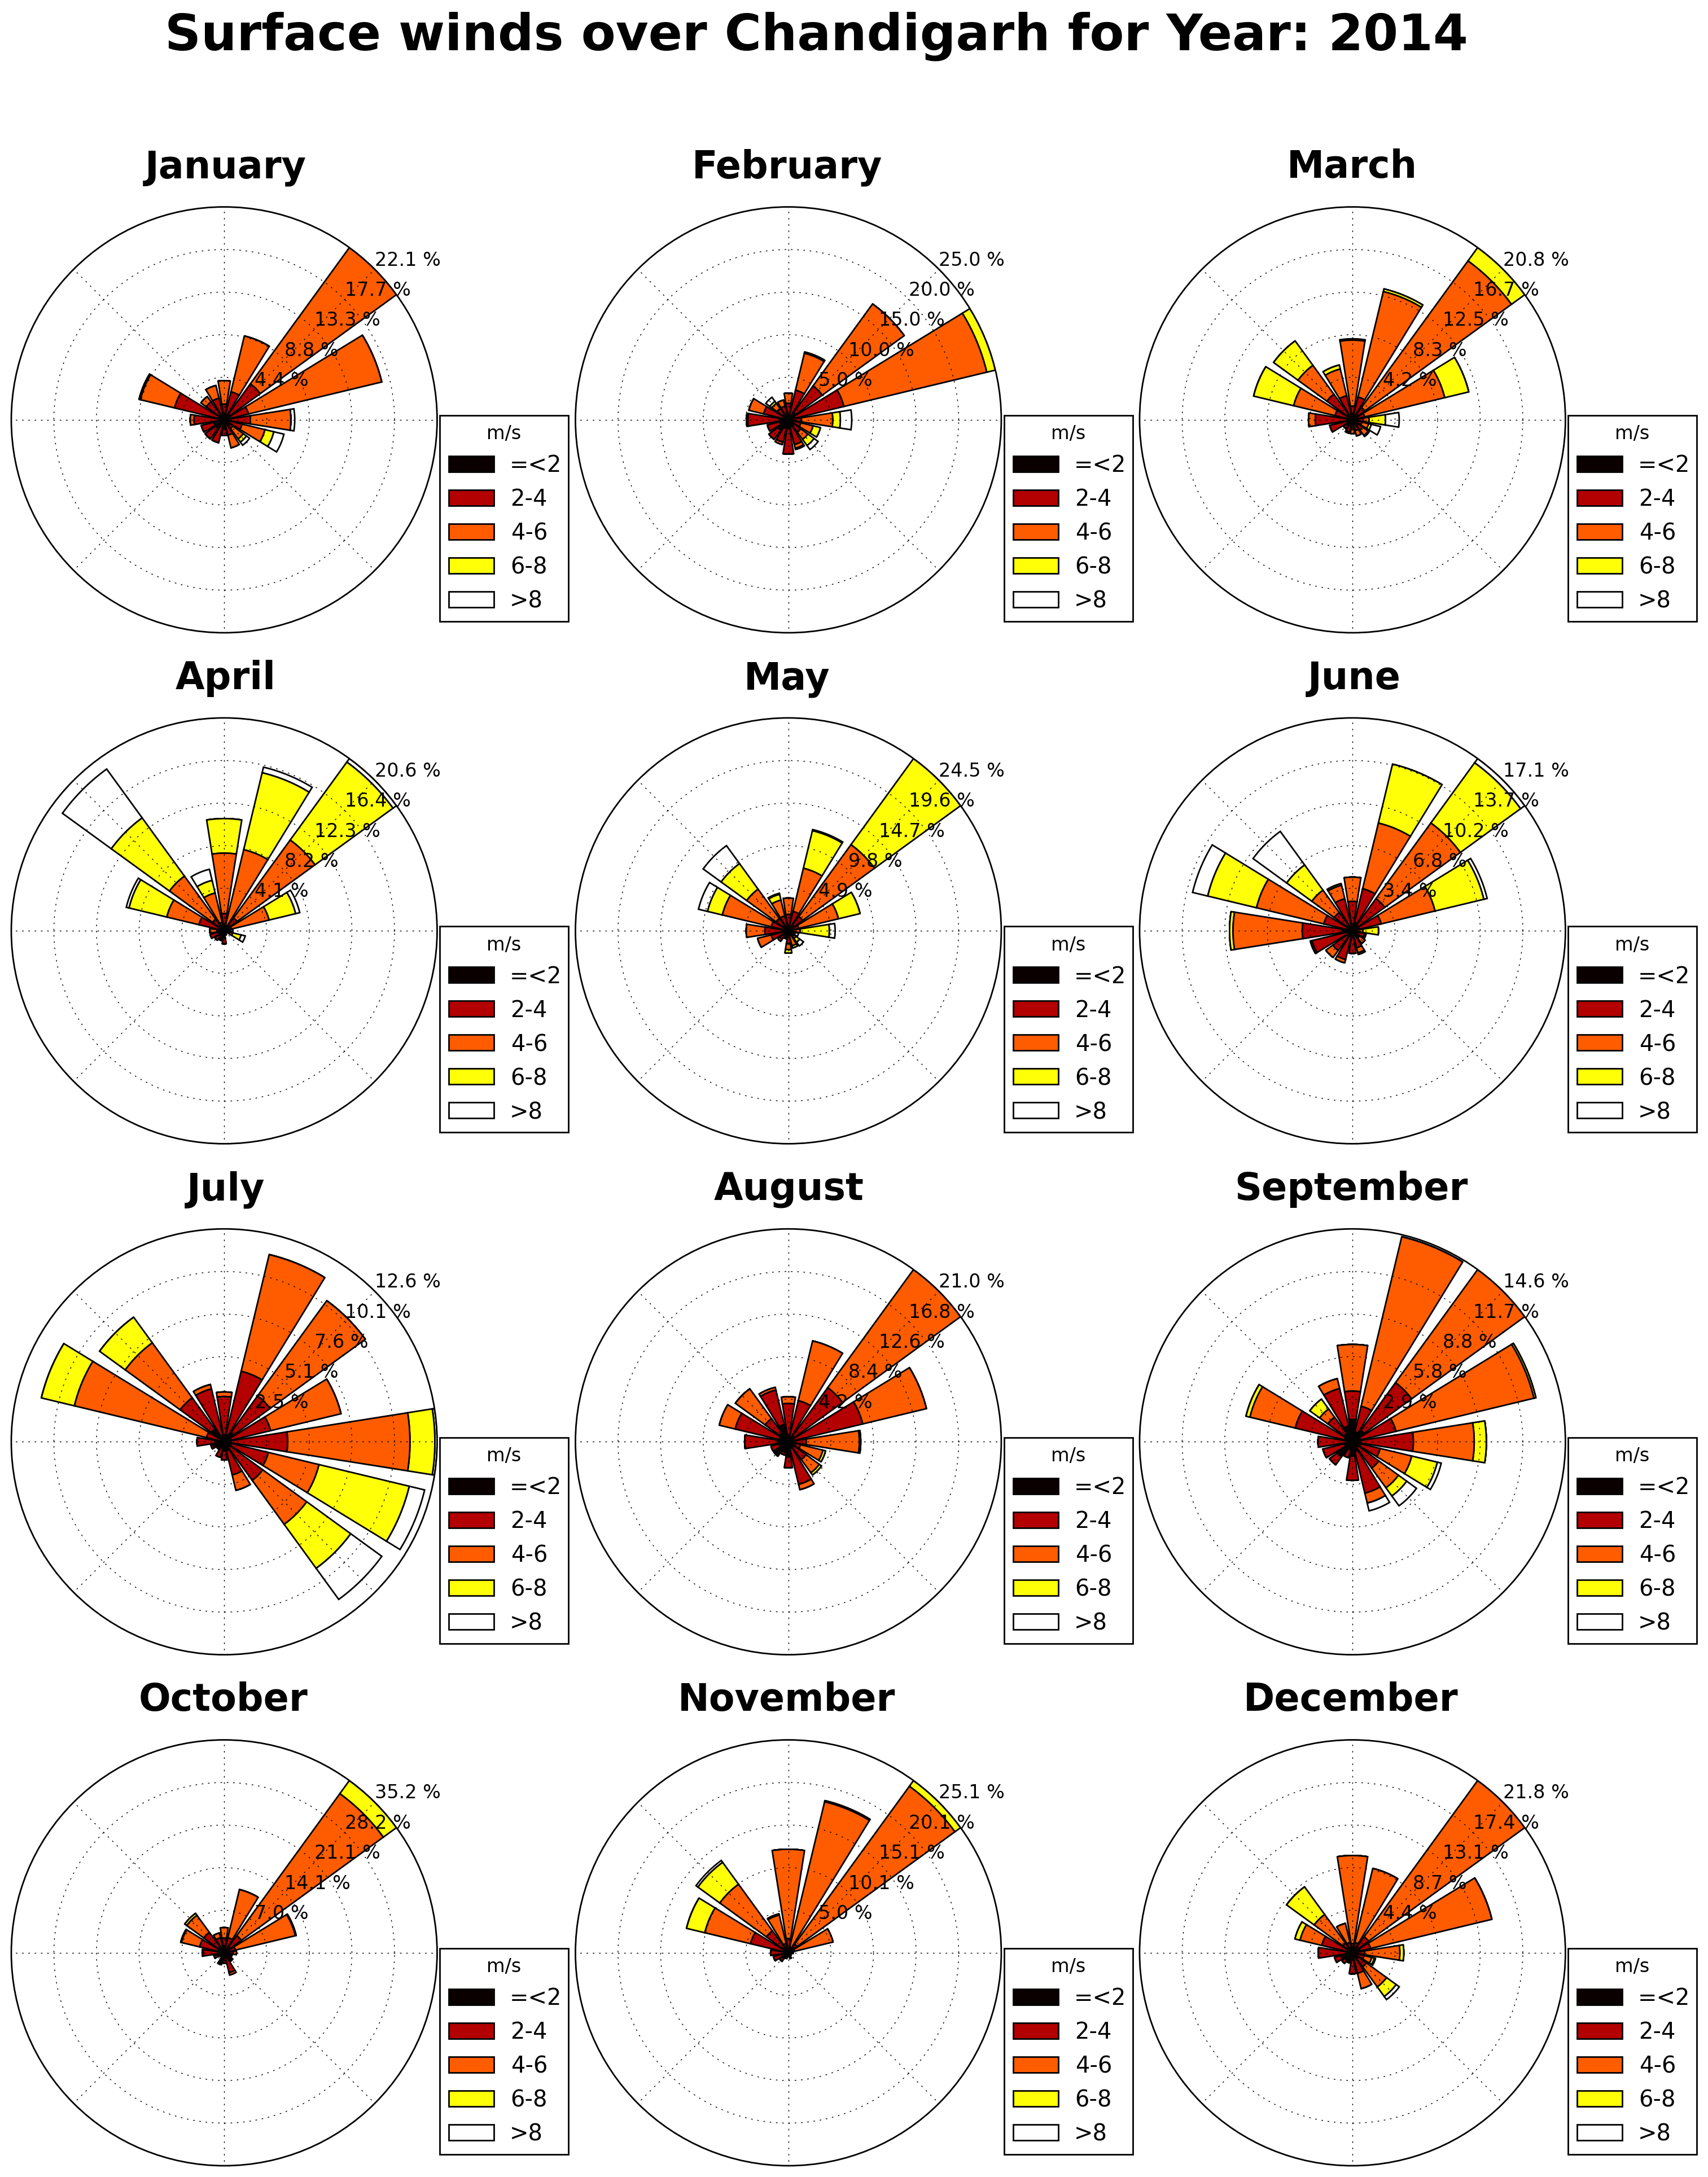
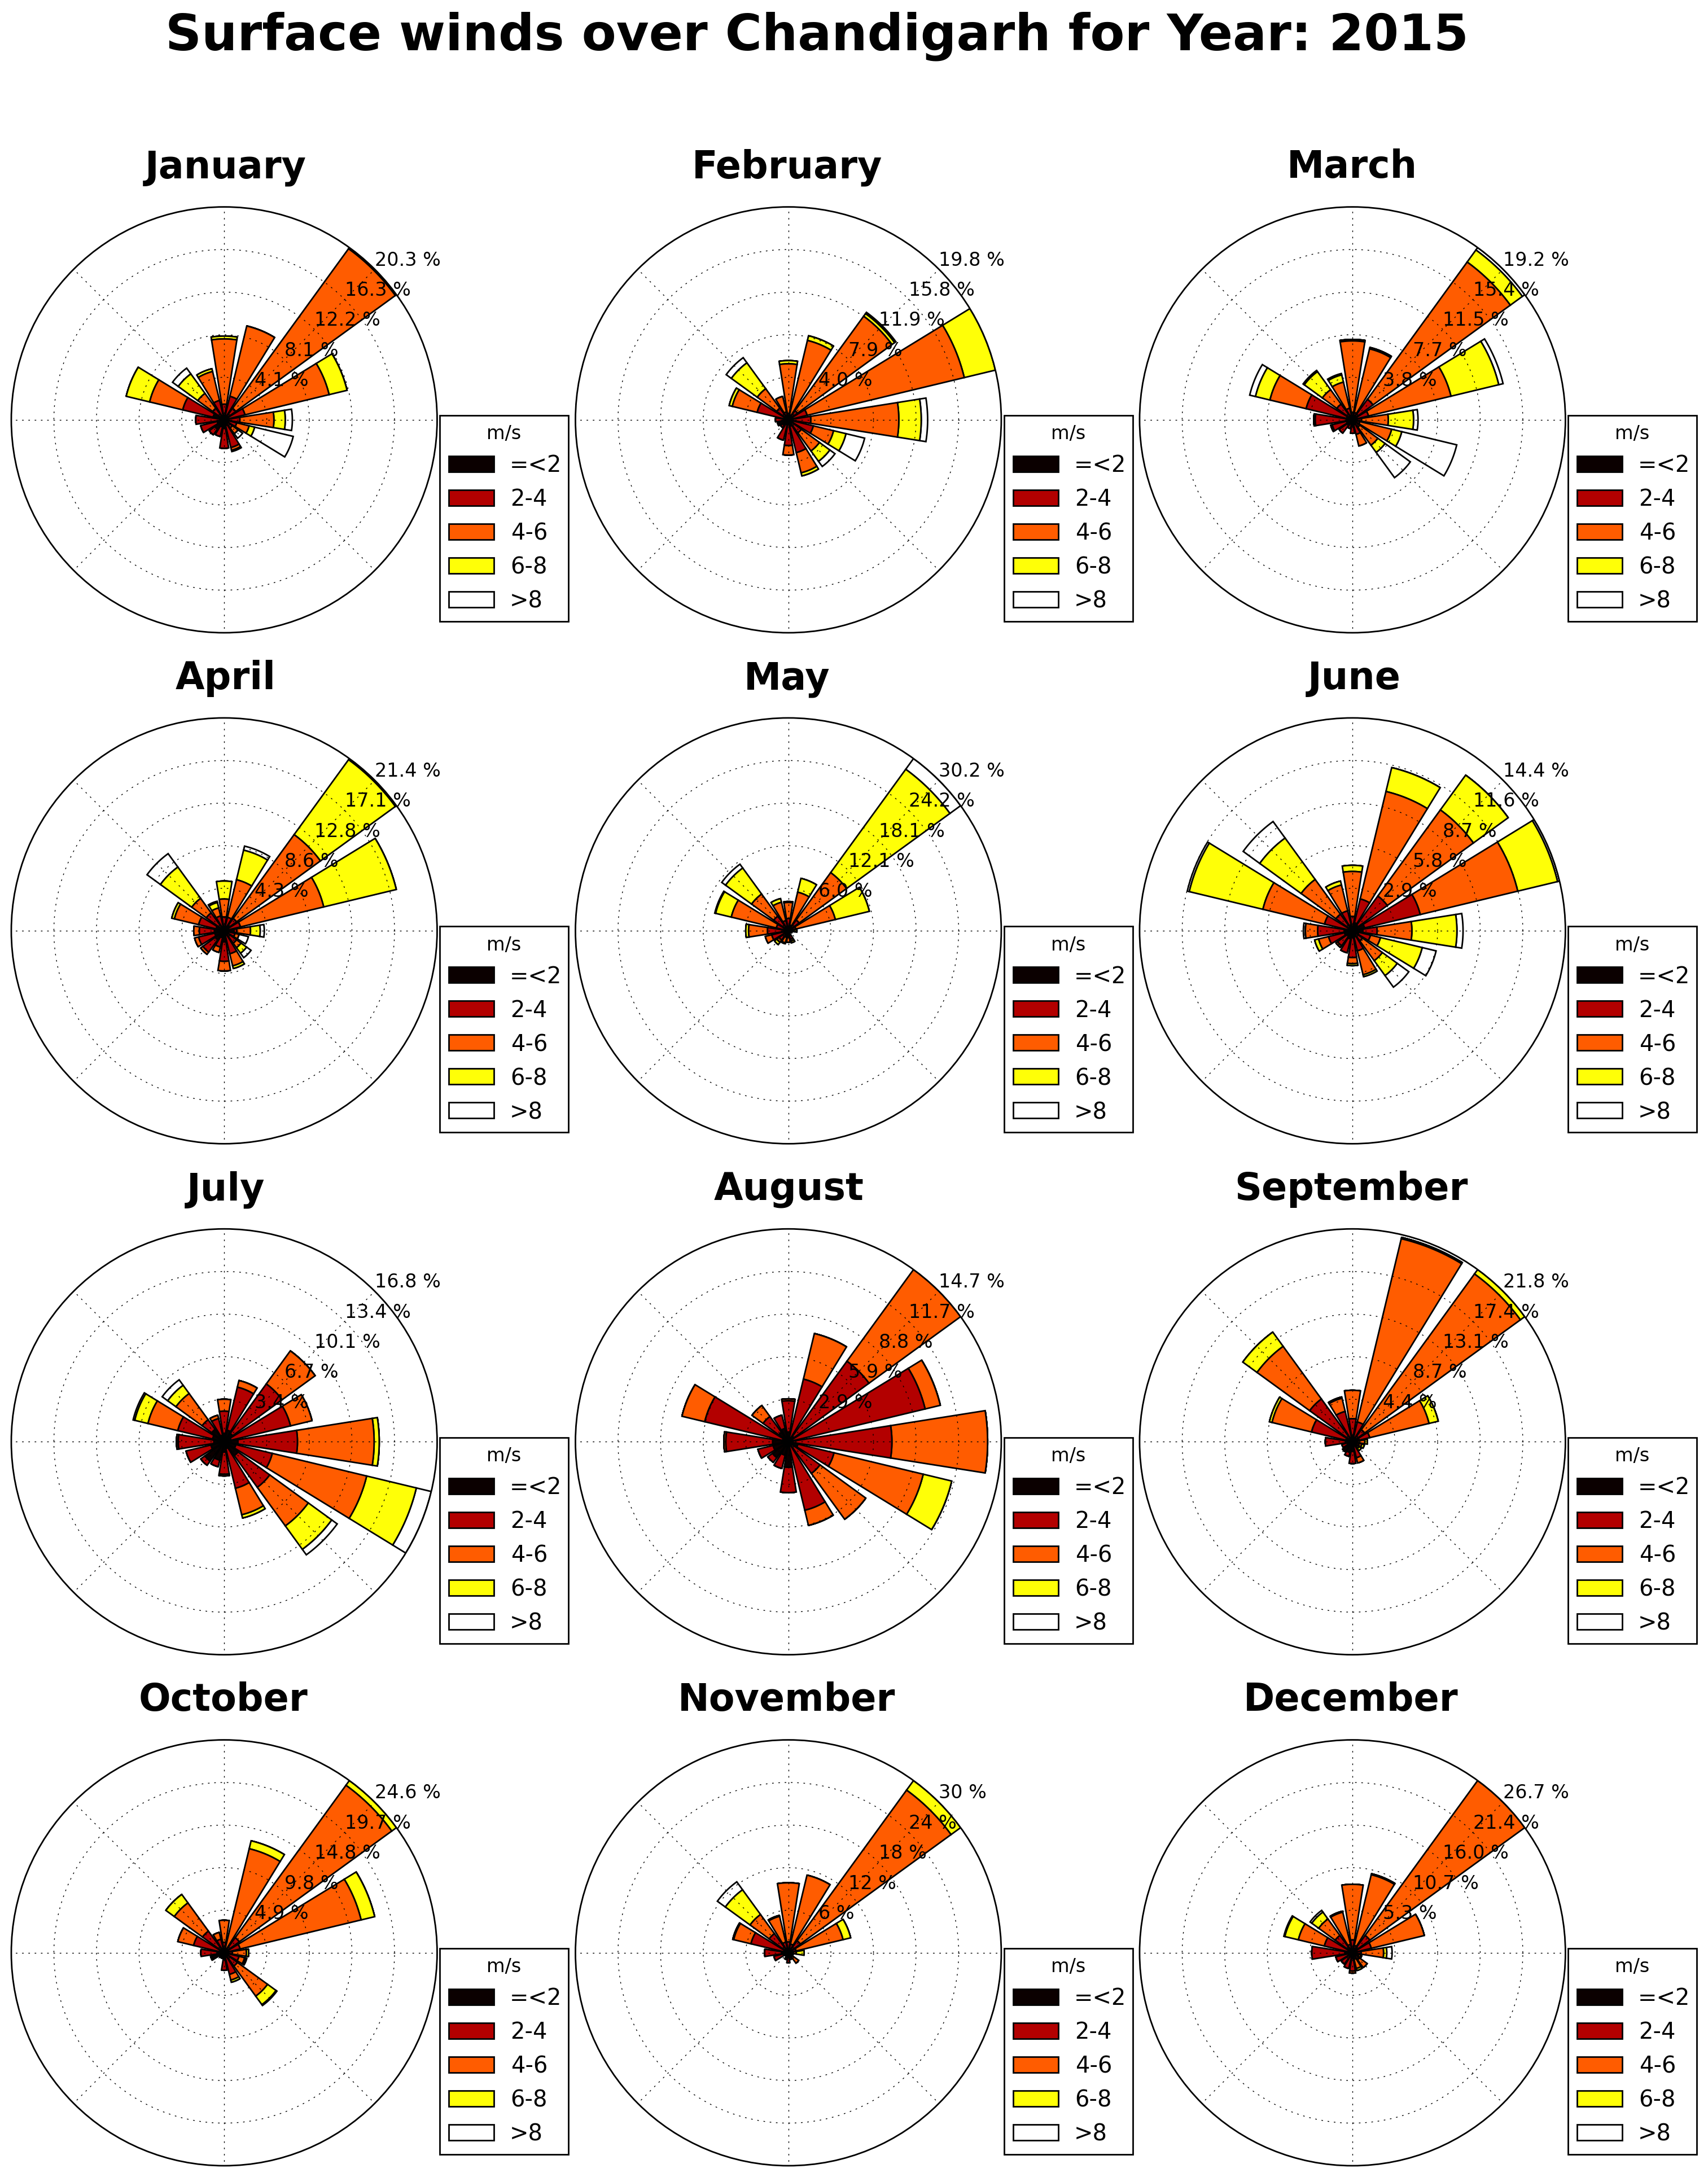
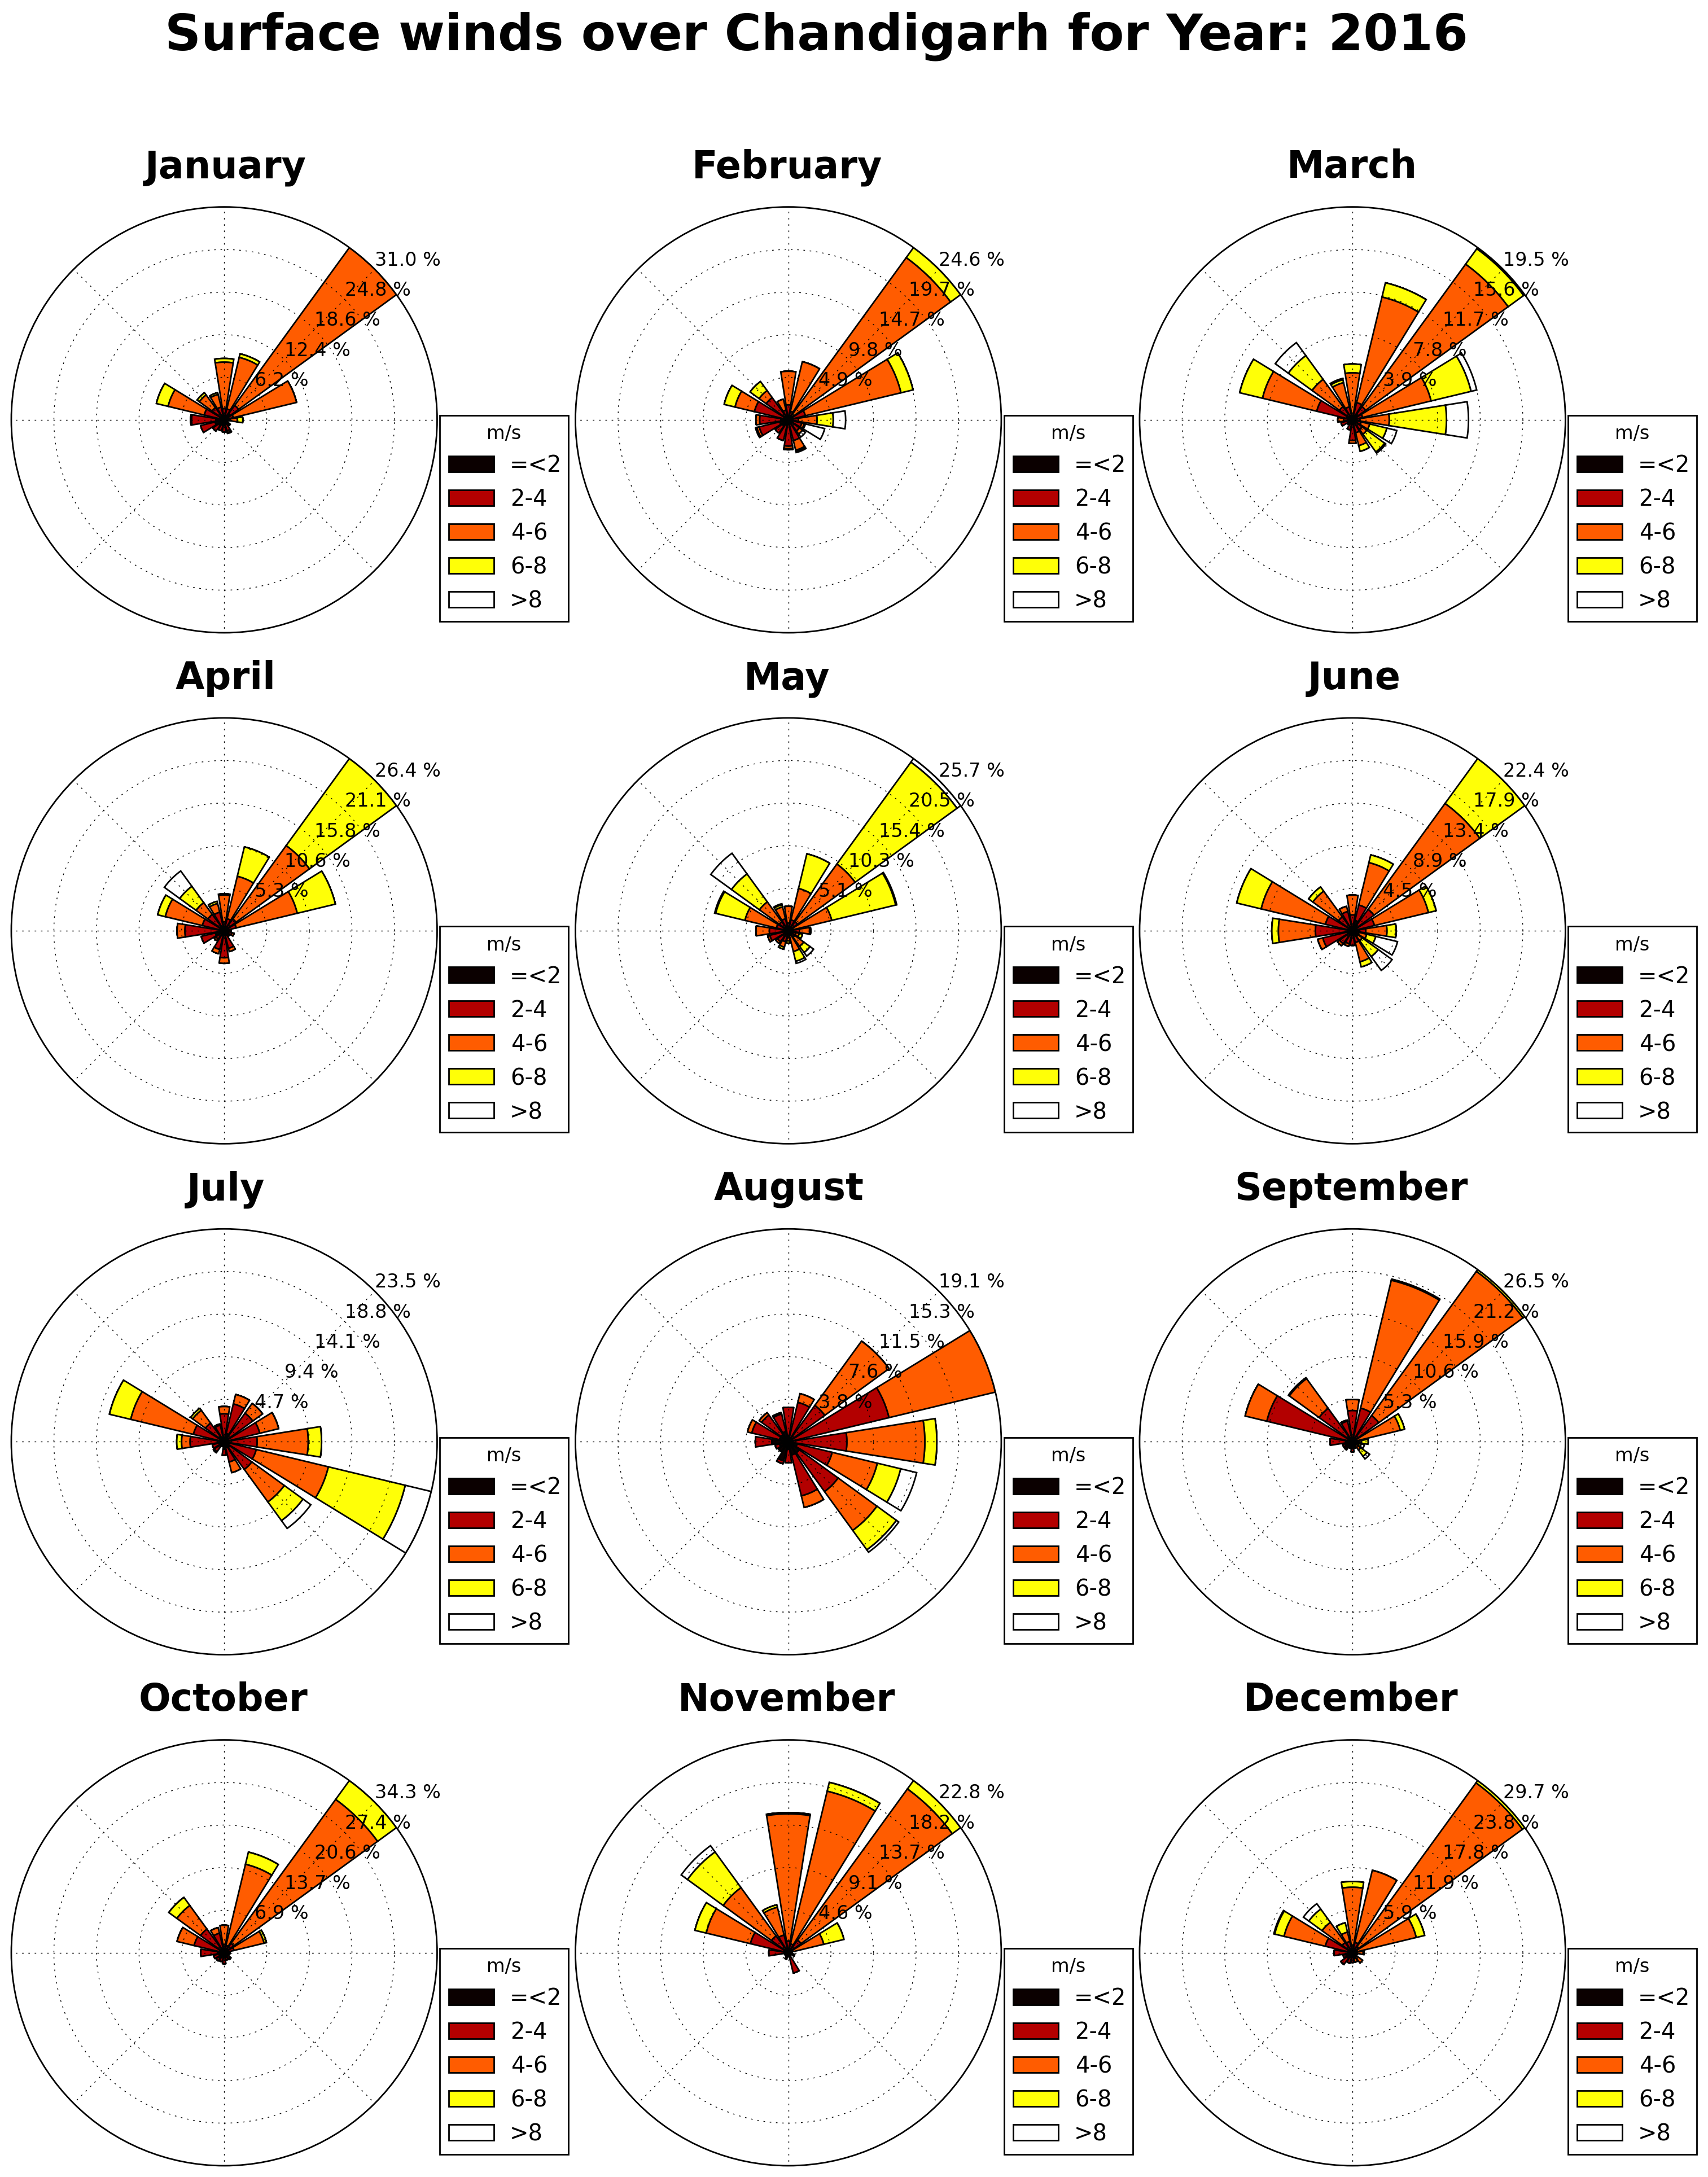
We processed the NCEP Reanalysis global meteorological fields from 2010 to 2016 through the 3D-WRF meteorological model. A summary of the data for year 2015, averaged for chandigarh is presented below. Download the processed data which includes information on year, month, day, hour, precipitation (mm/hour), mixing height (m), temperature (C), wind speed (m/sec), and wind direction (degrees) – key parameters which determine the intensity of dispersion of emissions.
Windrose Functions for 2013-2016
 |
 |
 |
 |
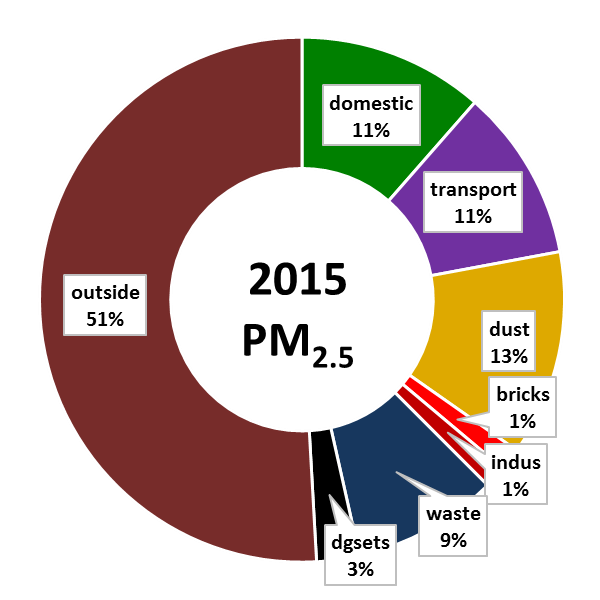
We calculated the ambient PM2.5 concentrations and the source contributions, using gridded emissions inventory, 3D meteorological data (from WRF), and the CAMx regional chemical transport model. The model simulates concentrations at 0.01° grid resolution and sector contributions to the urban area, which include contributions from primary emissions, secondary sources via chemical reactions, and long range transport via boundary conditions (represented as “outside” in the pie graph below).
 |
 |
 |
- Modeled urban average ambient PM2.5 concentration is 58.1 ± 6.9 μg/m3 – is above the national standard (40) and more than 5 times the WHO guideline (10)
- The city requires at least 27 continuous air monitoring stations to statistically, spatially, and temporally, represent the mix of sources and range of pollution in the city (current status – 5 manual and 1 continuous)
- The modeled source contributions highlight transport (including on road dust), domestic cooking and heating, and open waste burning as the key air pollution sources in the urban areas
- The city has an estimated 51% of the ambient annual PM2.5 pollution (in 2015) originating outside the urban airshed, which suggests that strong regional interventions are necessary to reduce the pollution loads in the city. This contribution is mostly stemming from coal-fired power plants, brick kilns located outside the urban airshed in the states of Haryana and Punjab, and well documented seasonal open biomass burning after the agricultural harvests
- The city is very well known for its urban design, and now needs to aggressively promote public and non-motorized transport as part of the city’s urban development plan, along with the improvement of the road infrastructure to reduce on-road dust re-suspension (which is partly enhanced due to the seasonal dust storms in the region)
- By 2030, the vehicle exhaust emissions are expected to remain constant, if and only if, Bharat 6 fuel standards are introduced nationally in 2020, as recommended by the Auto Fuel Policy
- By 2030, the share of emissions from residential cooking and lighting is expected to decrease with a greater share of LPG, residential electrification, and increasing urbanization. However, since the availability of biomass and coal in the region is high, a fair share of its use is expected to continue, unless an aggressive program is in place a 100% technology shift to cleaner options like LPG and electricity
- The 160 mapped brick kilns in the urban airshed are fueled mostly by coal, agri-waste, and sometime random feeds like discarded tires. These kilns can benefit from a technology upgrade from the current fixed chimney and clamp style baking to (for example) zig-zag, in order to improve their overall energy efficiency. Similarly, the coal-fired power plants closer to the urban centers need to practice and enforce stricter environmental standards for all the criteria pollutants
- Open waste burning is dispersed across the city and requires stricter regulations for addressing the issue, as the city generates ever more garbage, with limited capacity to sort and dispose of it.
Back to the APnA page.
All the analysis and results are sole responsibility of the authors @ UrbanEmissions.Info. Please send you comments and questions to simair@urbanemissions.info