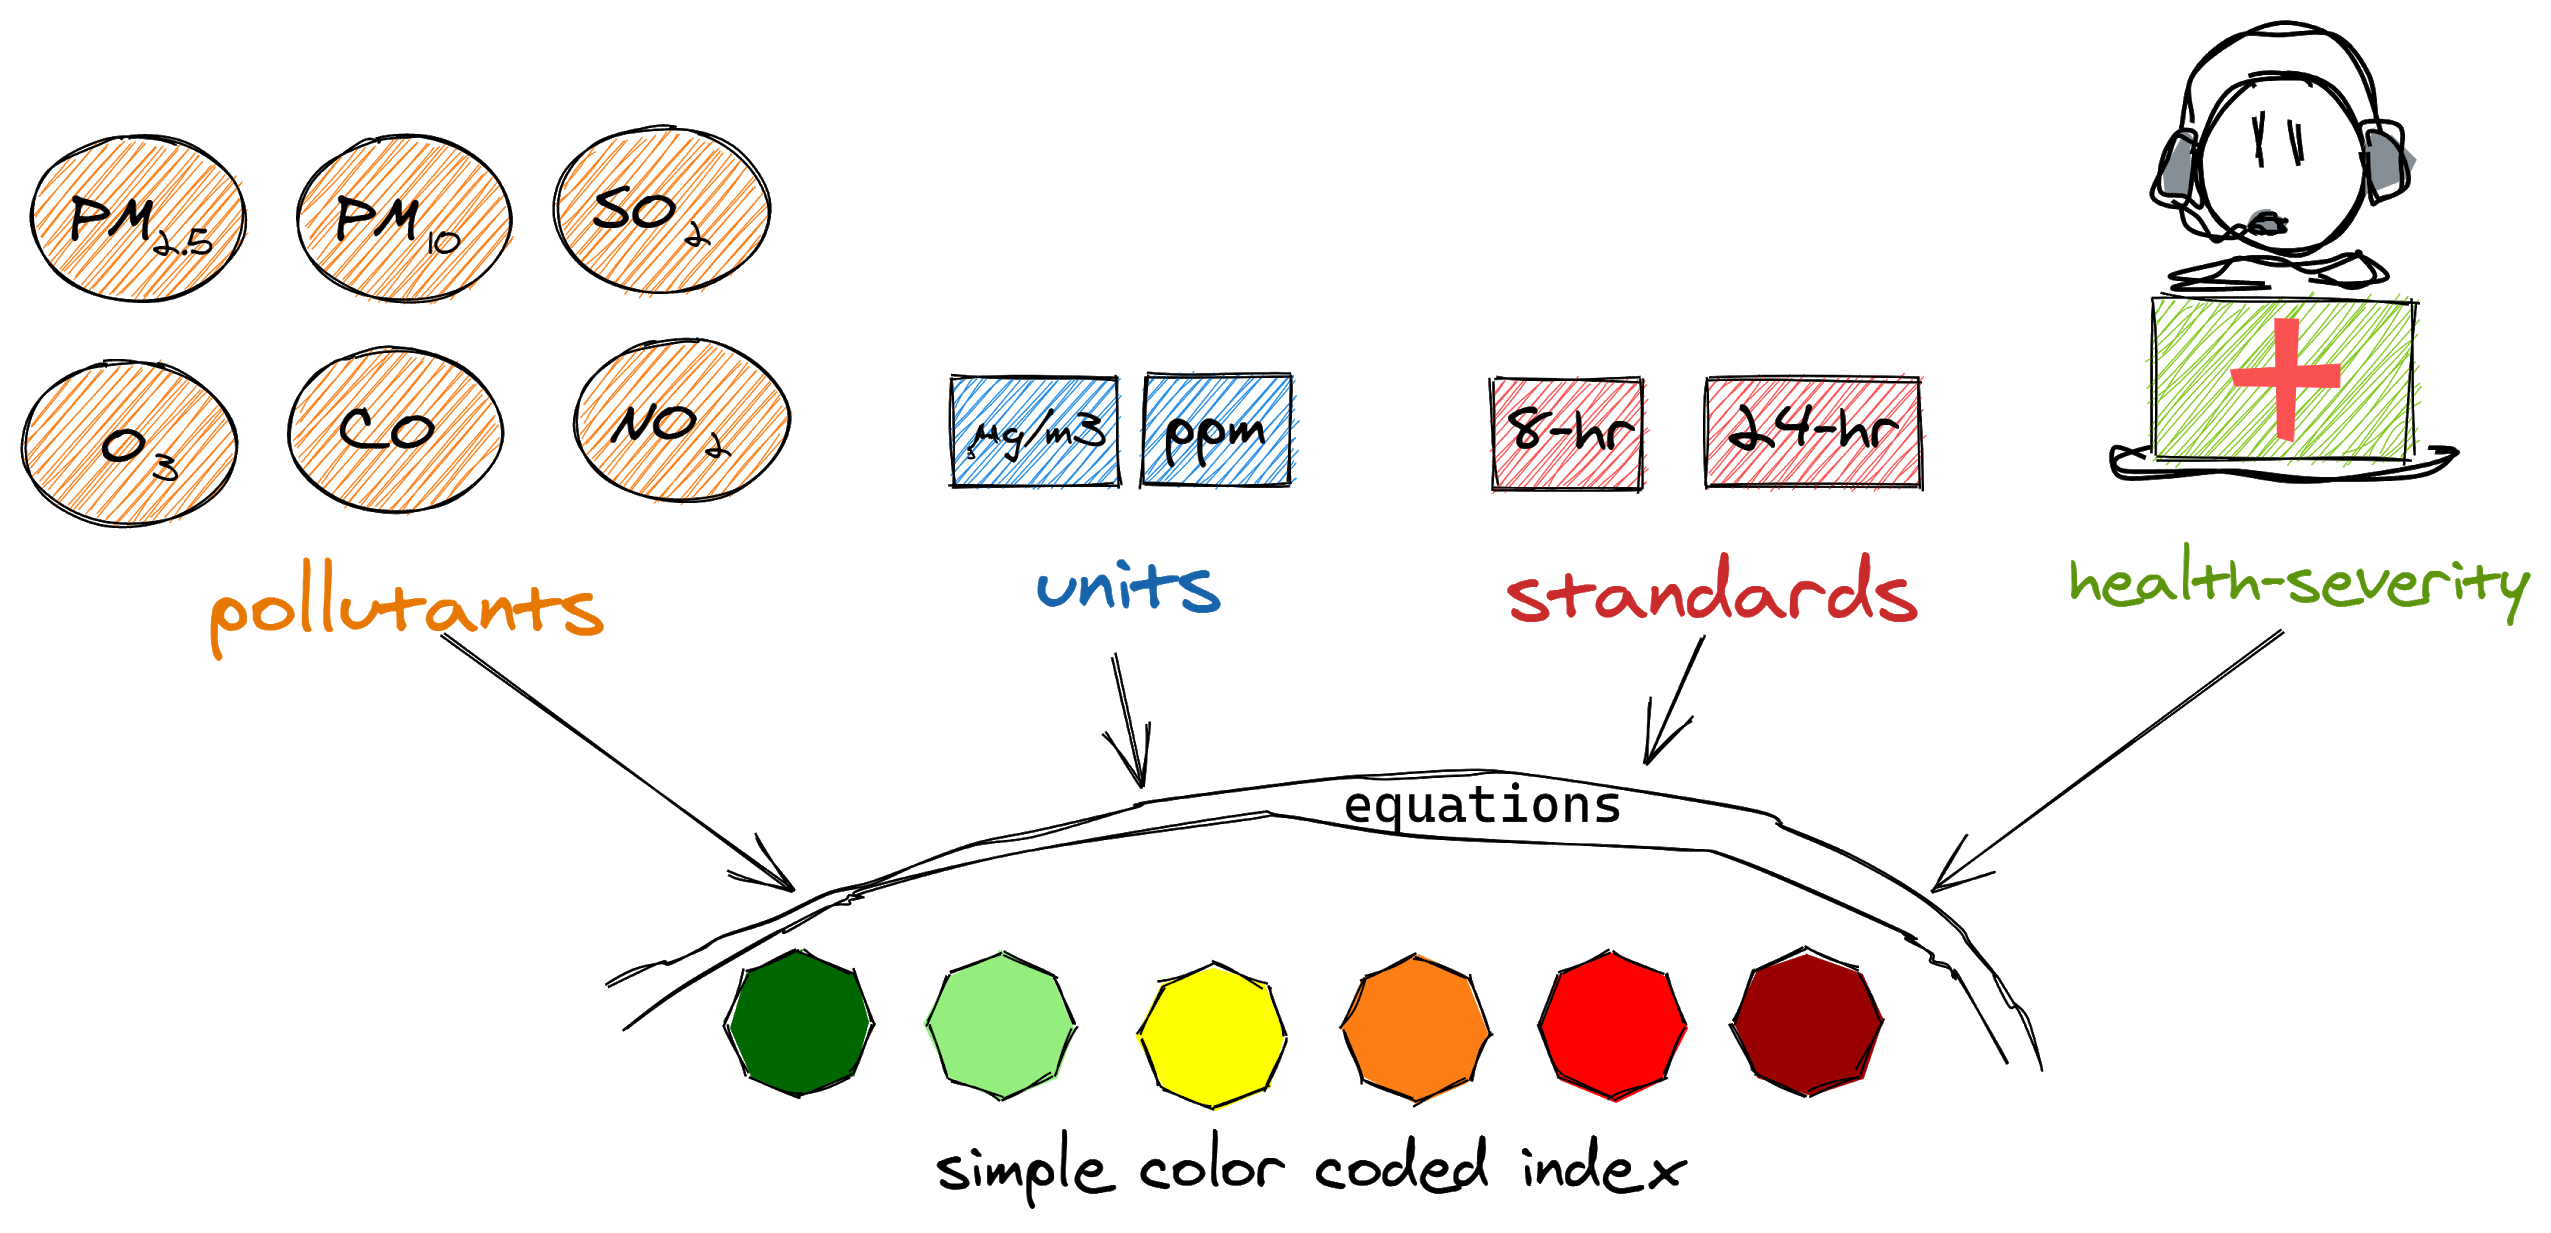
 Air Quality Index (AQI) is a unit less number which unifies all the complicated (a) science of pollution composition, (b) exposure rate based health severity, (c) ambient standards, and (d) measurement and standard protocols, into simple color coded alerts of good or bad or severe air pollution categories.
Ten Frequently Asked Questions on AQI
 While simple, this topic still raising some confusing questions during a conversation. The following questions are detailed in the SIM-air Working Paper # 46-2021. Click on the report cover to access PDF.
- What is the difference between air quality and air quality index?
- Is it better to report pollutant concentrations or pollutant AQI values?
- How is AQI calculated?
- Every criteria pollutant has an index value, then which one decides “AQI of the day”?
- What is the difference between Indian, Chinese, USA, EU, and other AQI
methodologies? - How many monitors are required to monitor to calculate AQI of a city?
- What is the difference between hourly and daily AQI?
- What is the meaning of AQI=500 or AQI=999?
- Is PM2.5 the most harmful of all air pollutants?
- Where can we access real time updates on air quality and AQI?
MS Excel Based AQI Calculators
Two calculators were developed to illustrate and evaluate AQI using seven (7) methodologies from USA, EU, UK, India, China, South Korea, and Singapore
- Version (01) calculates AQI for one time data [Download]
- Version (02) calculates AQI for a large dataset and charts a comparison [Download]
Both the calculators require the user to activate Macros in MS Excel and follow instructions. Instructional videos for version-01 (less than 3 minutes) and version-02 (less than 4 minutes) explain the steps and the format of the required inputs.