These are visuals made with information from studies conducted at UrbanEmissions.Info, media reports, and other sources. All the infographics are available for open use. Click on download to see the image or right click on download to save the full resolution images.
- Infographic primers
- A primer on air quality management (2008) (browse)
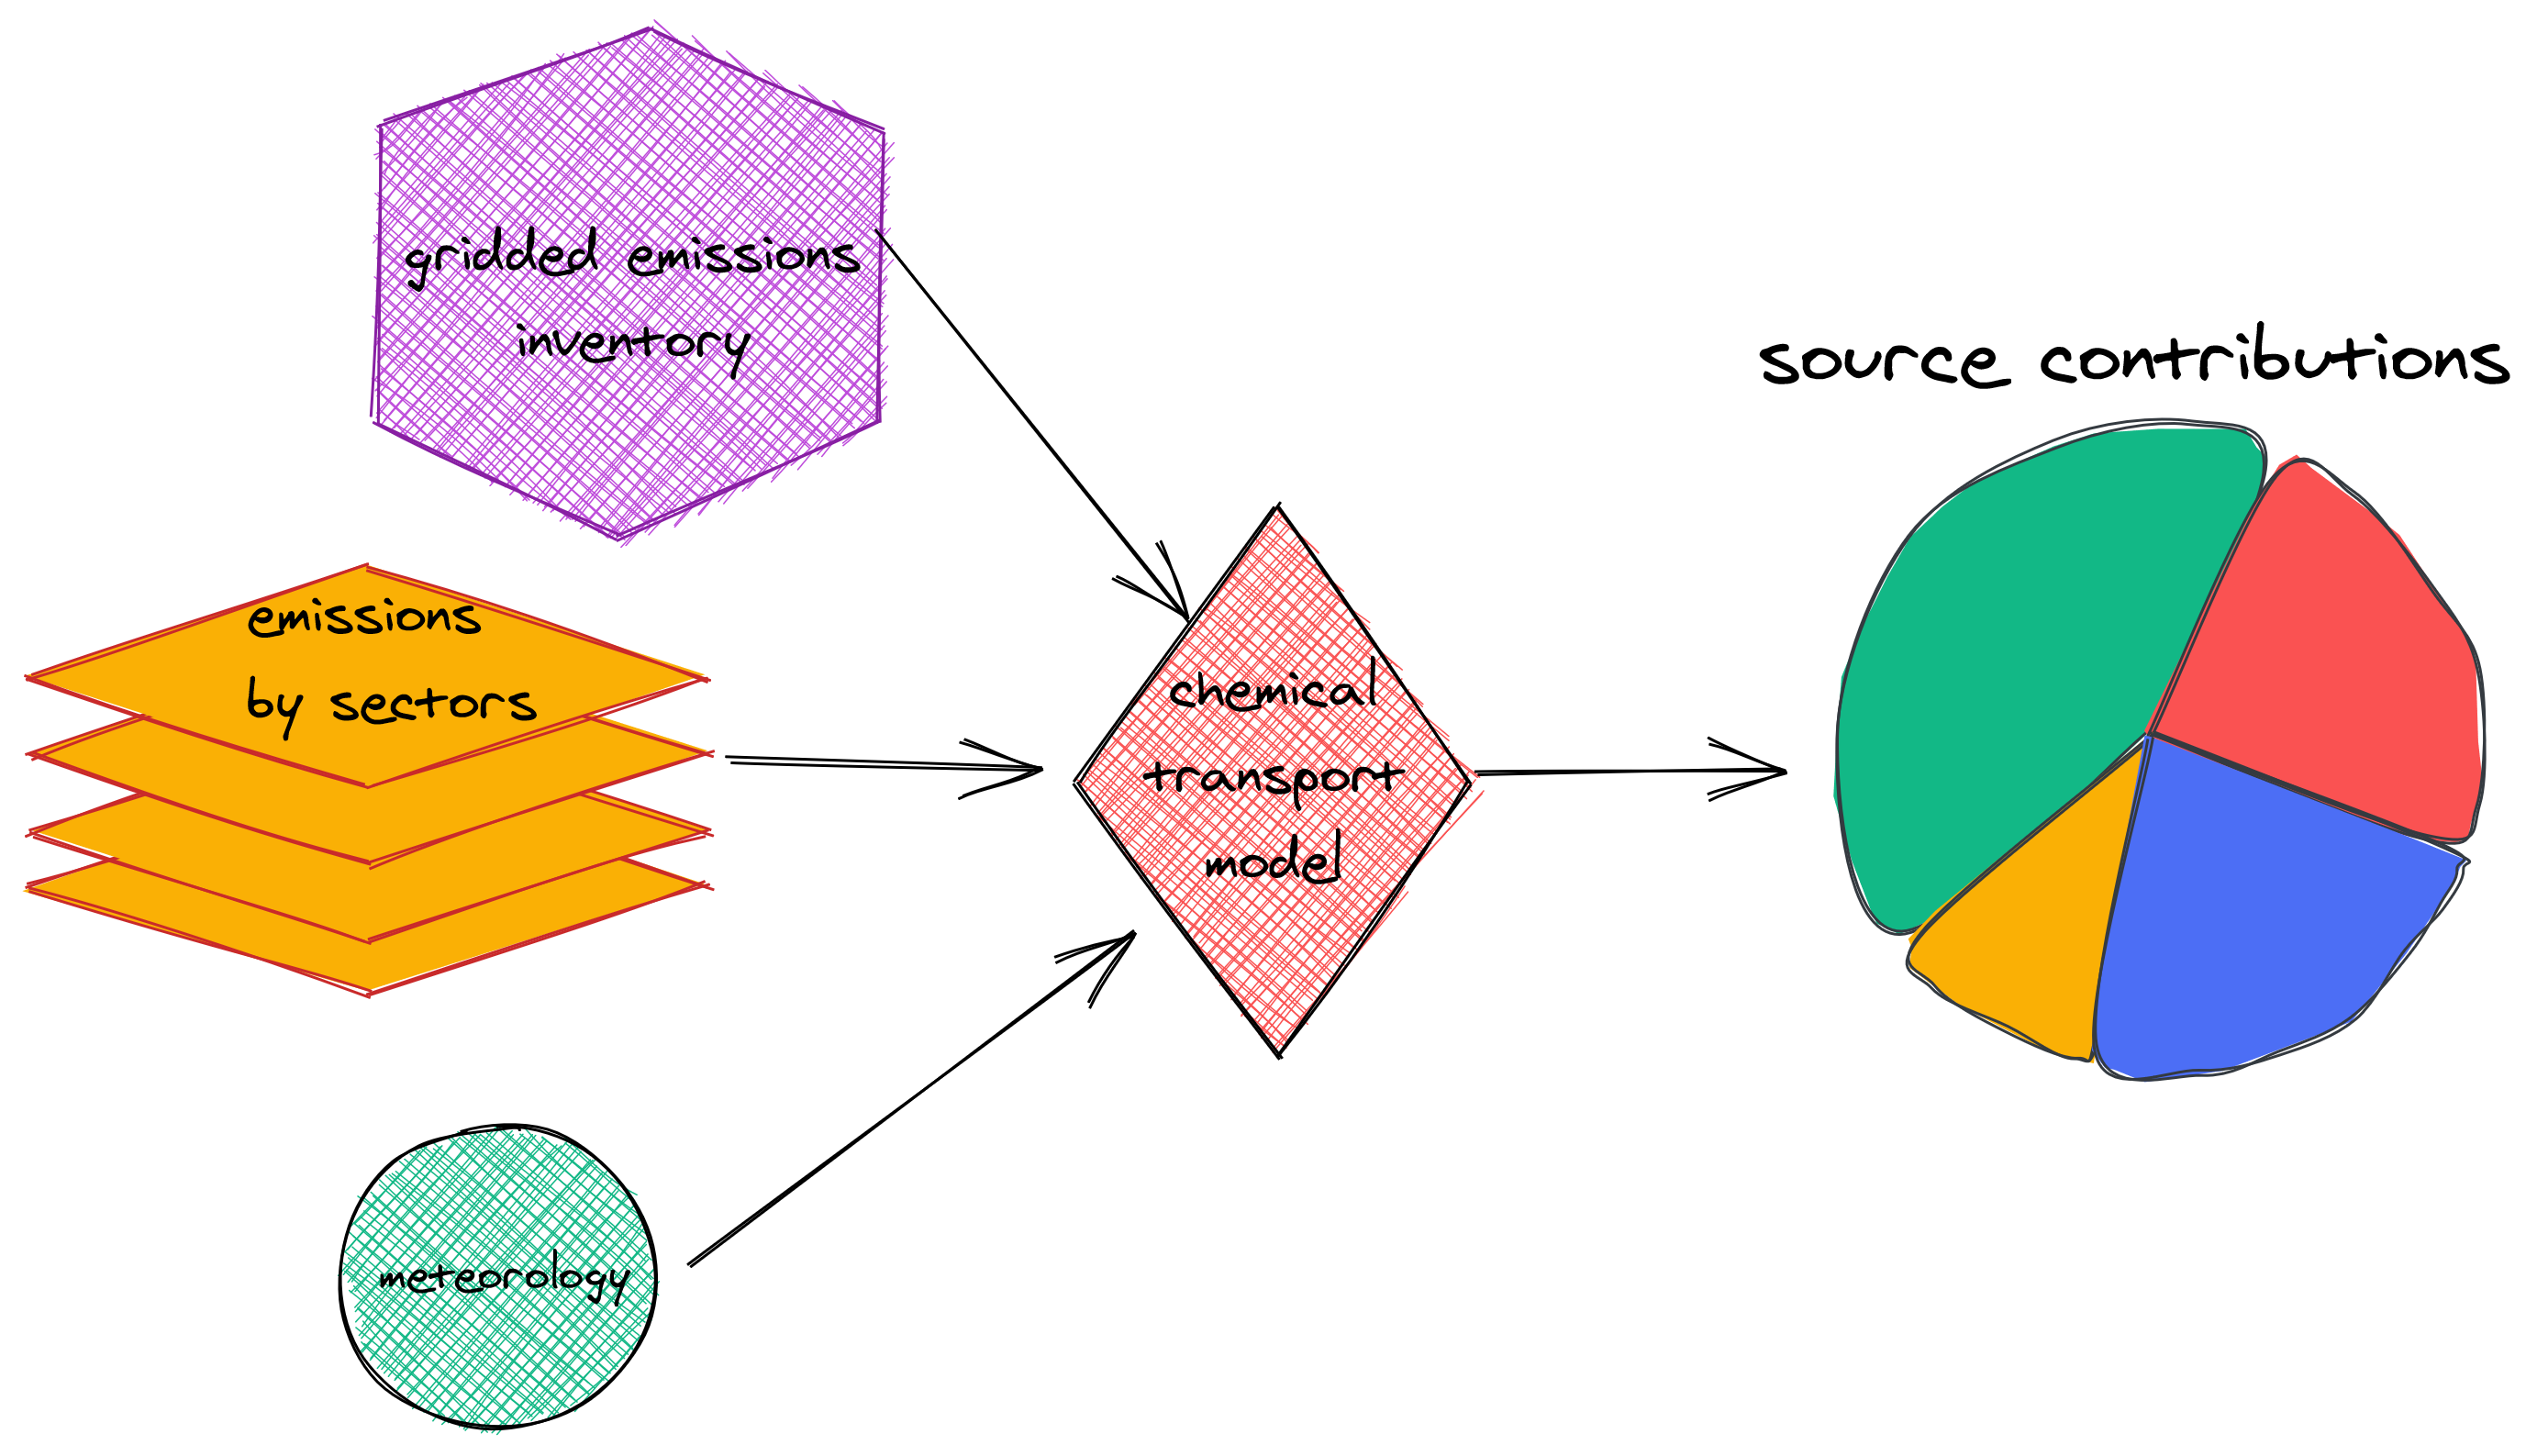
- A primer on source apportionment (2011) (browse)
- A primer on composting wet waste (2011) (browse)
- A primer on air pollution monitoring (2023) (browse)
- A primer on air pollution monitoring (2023) – in Hindi (browse)
- A primer on know your air pollutants (2023) (browse)
- Infographic posters
- AGU 2022 – High Resolution (1-km) Emissions and Pollution Modelling to Evaluate Air Quality (PM2.5) in Addis Ababa (Ethiopia) and Kampala (Uganda) (download)
- EGU 2023 – APnA city program in Asia and Africa (download)
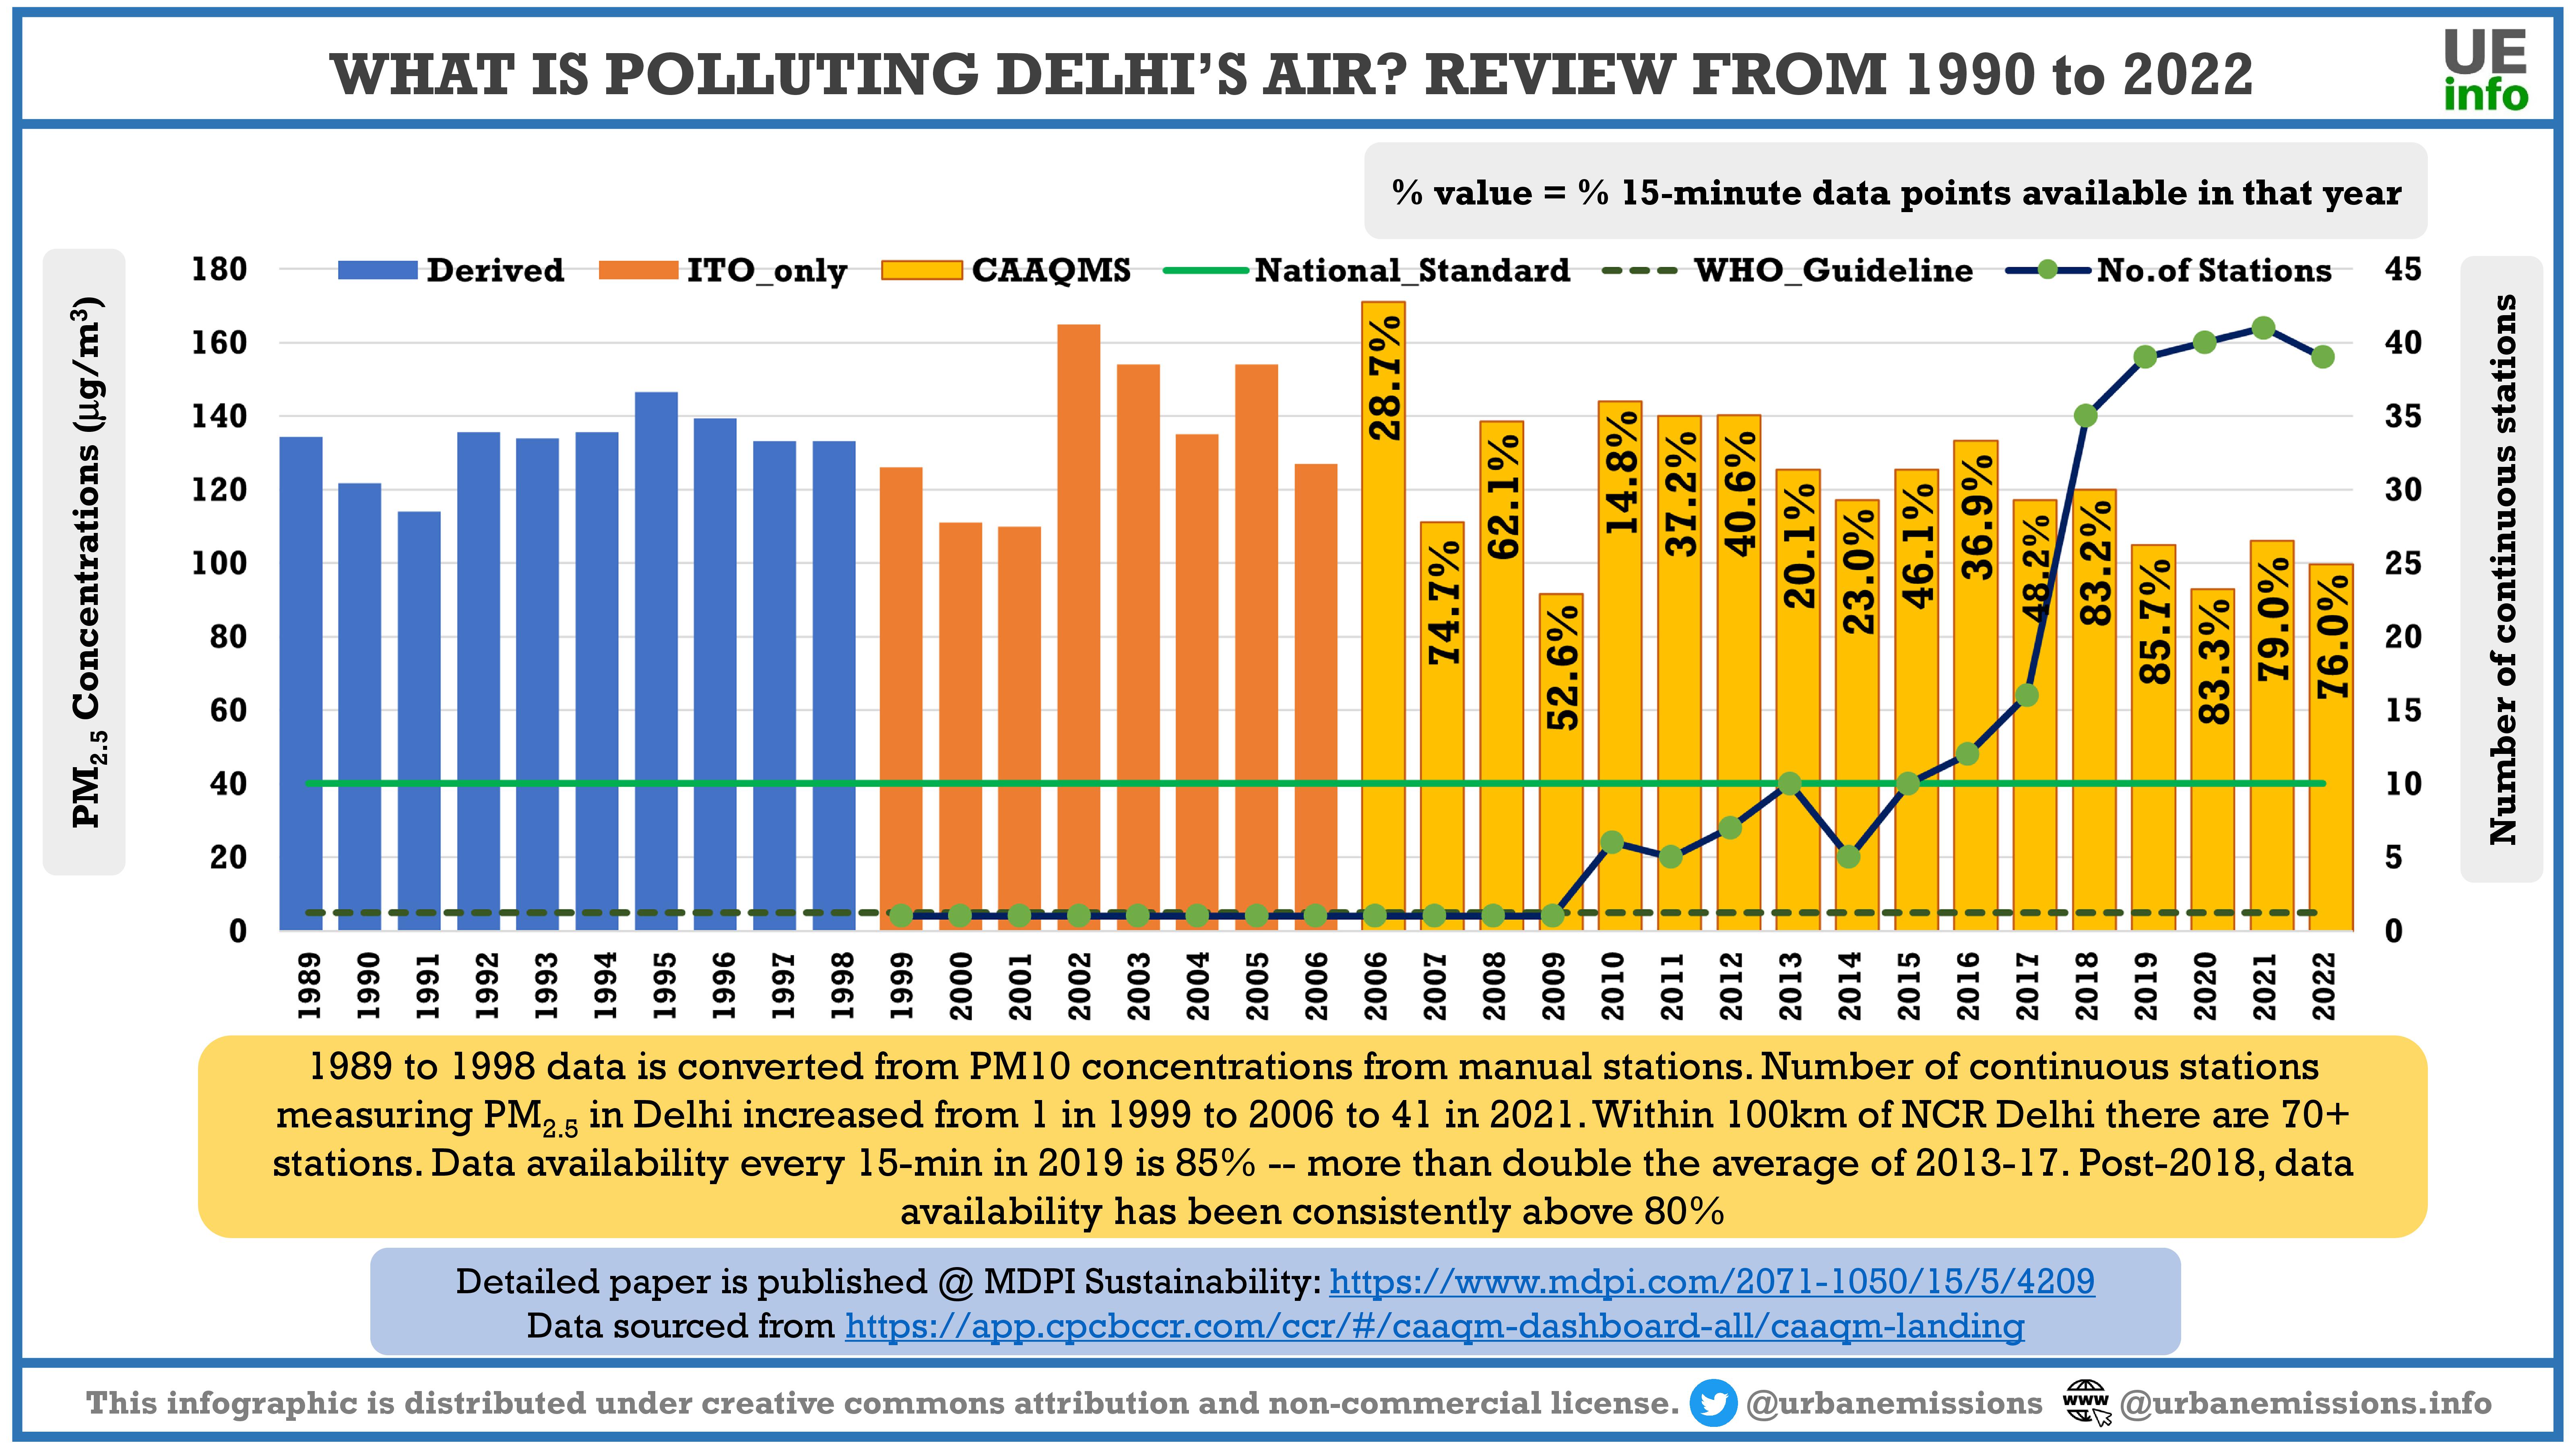
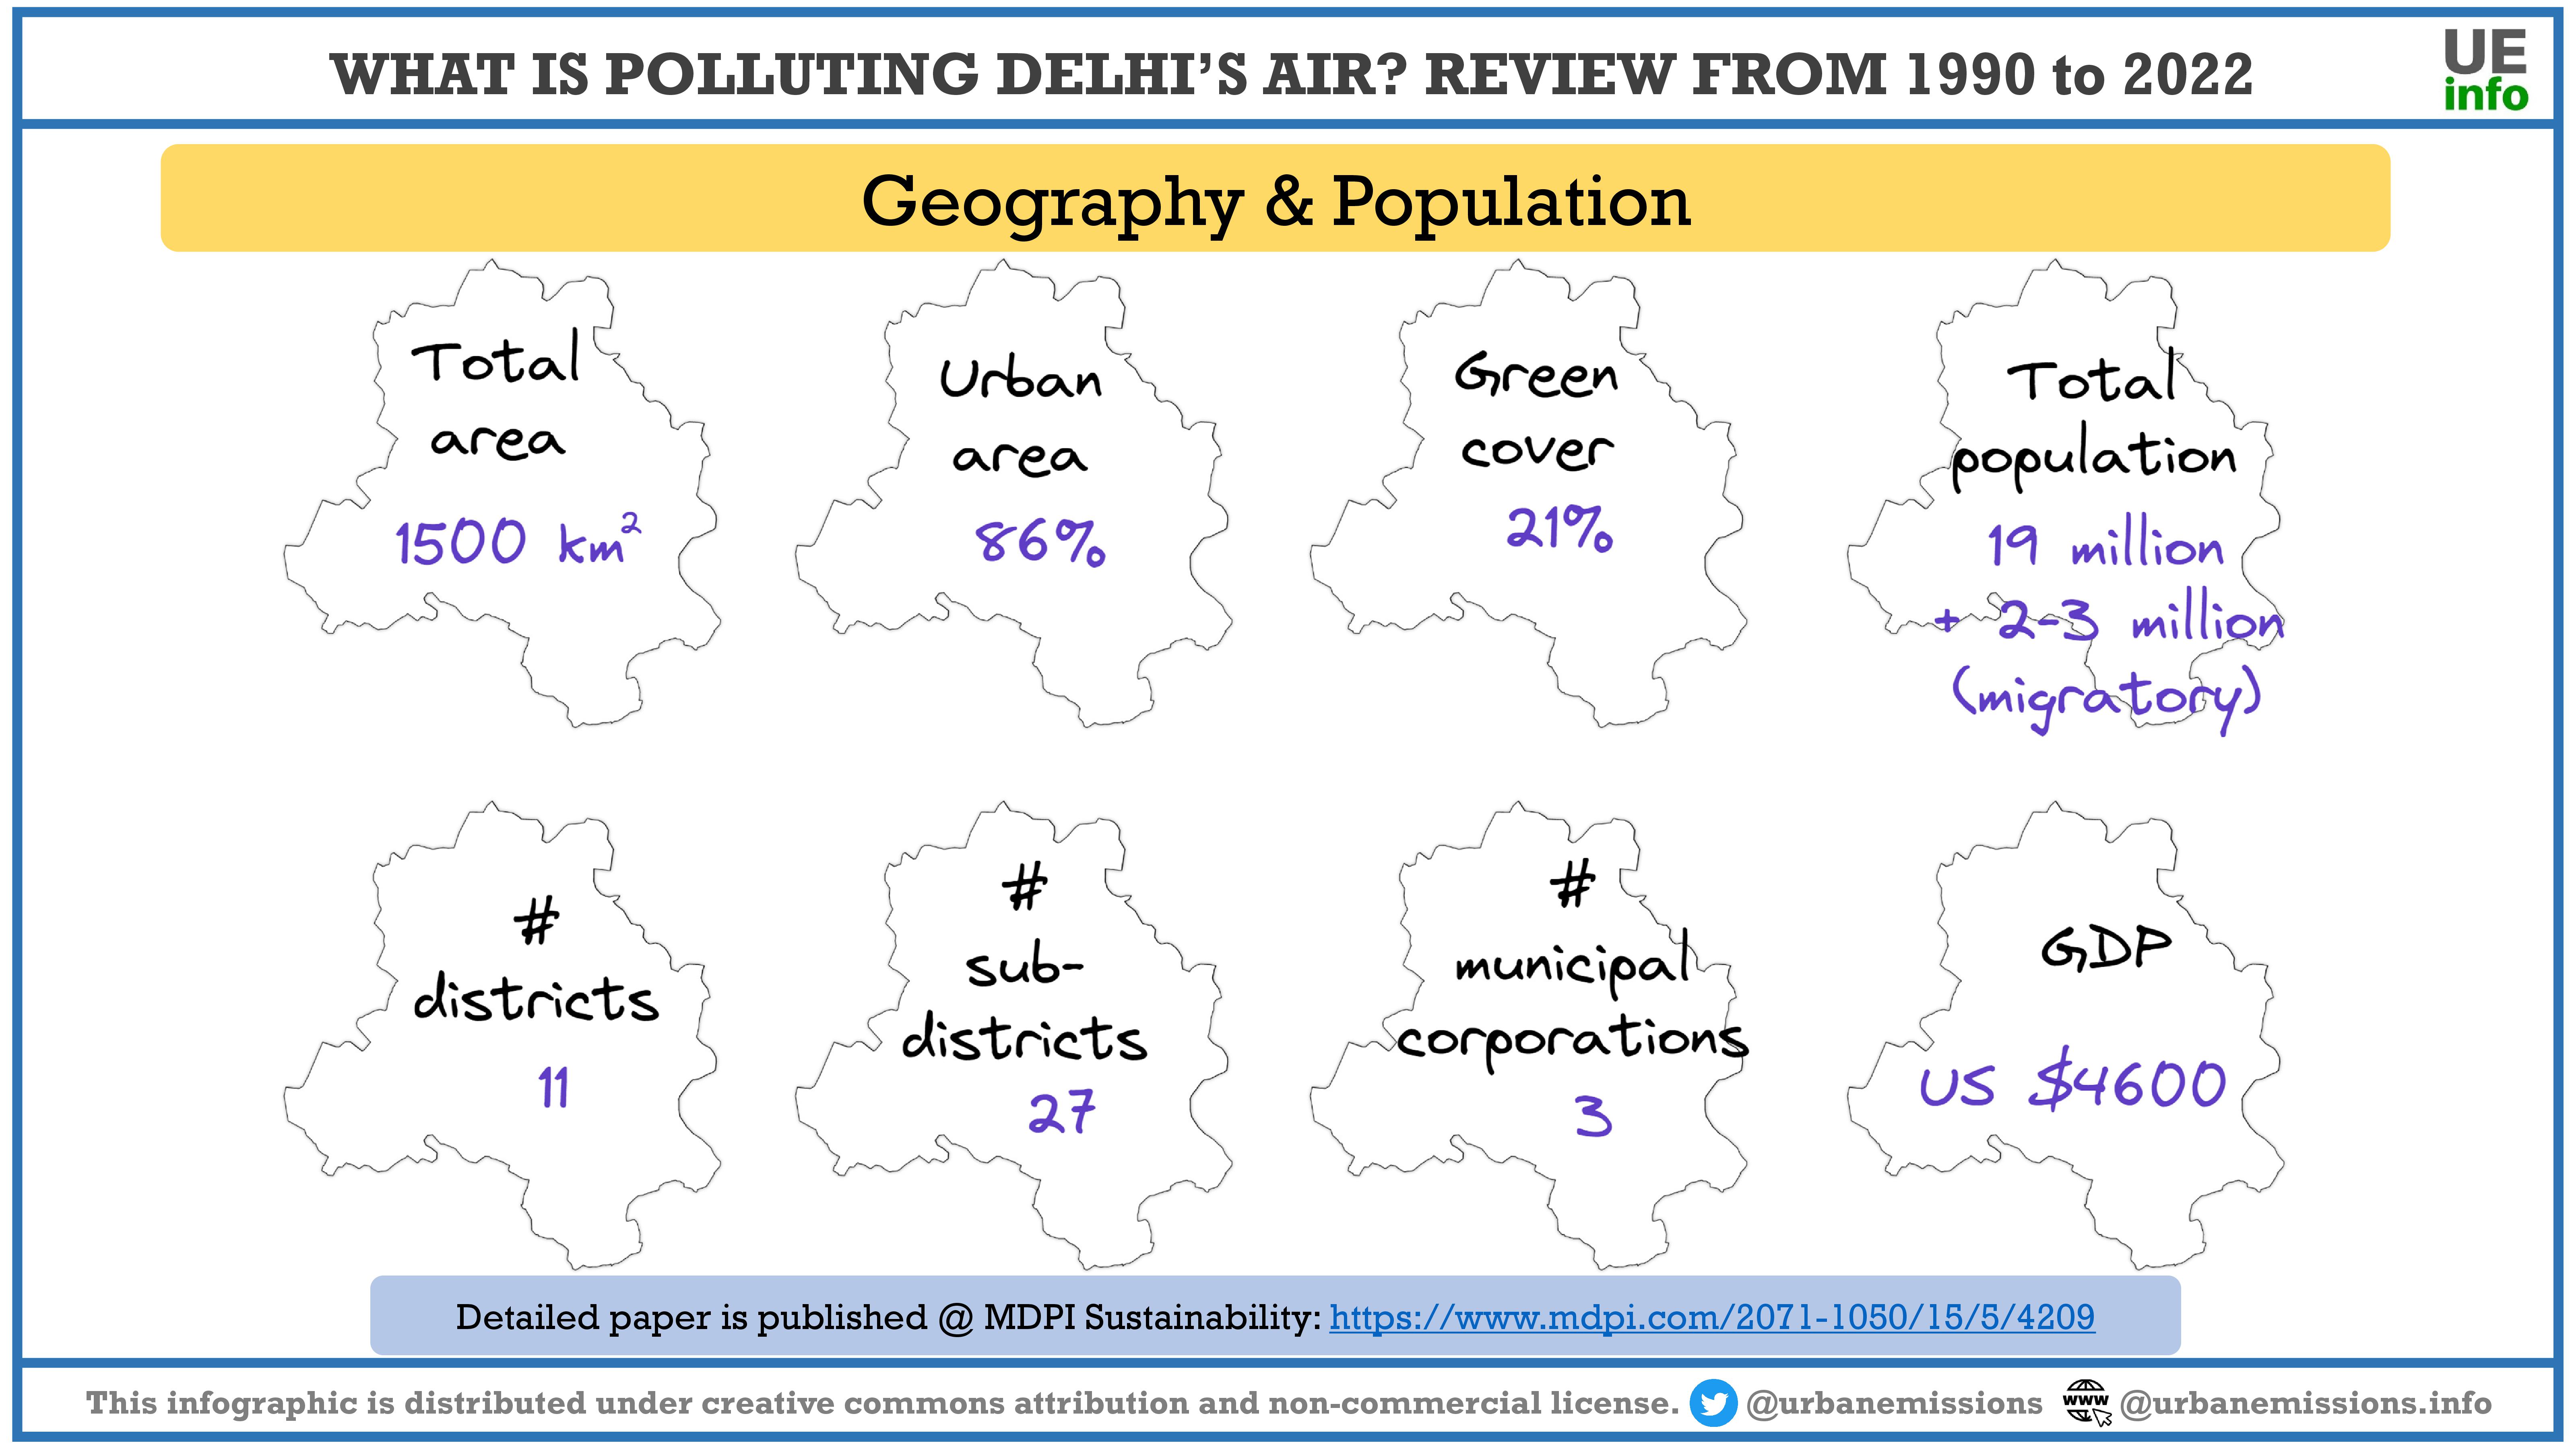
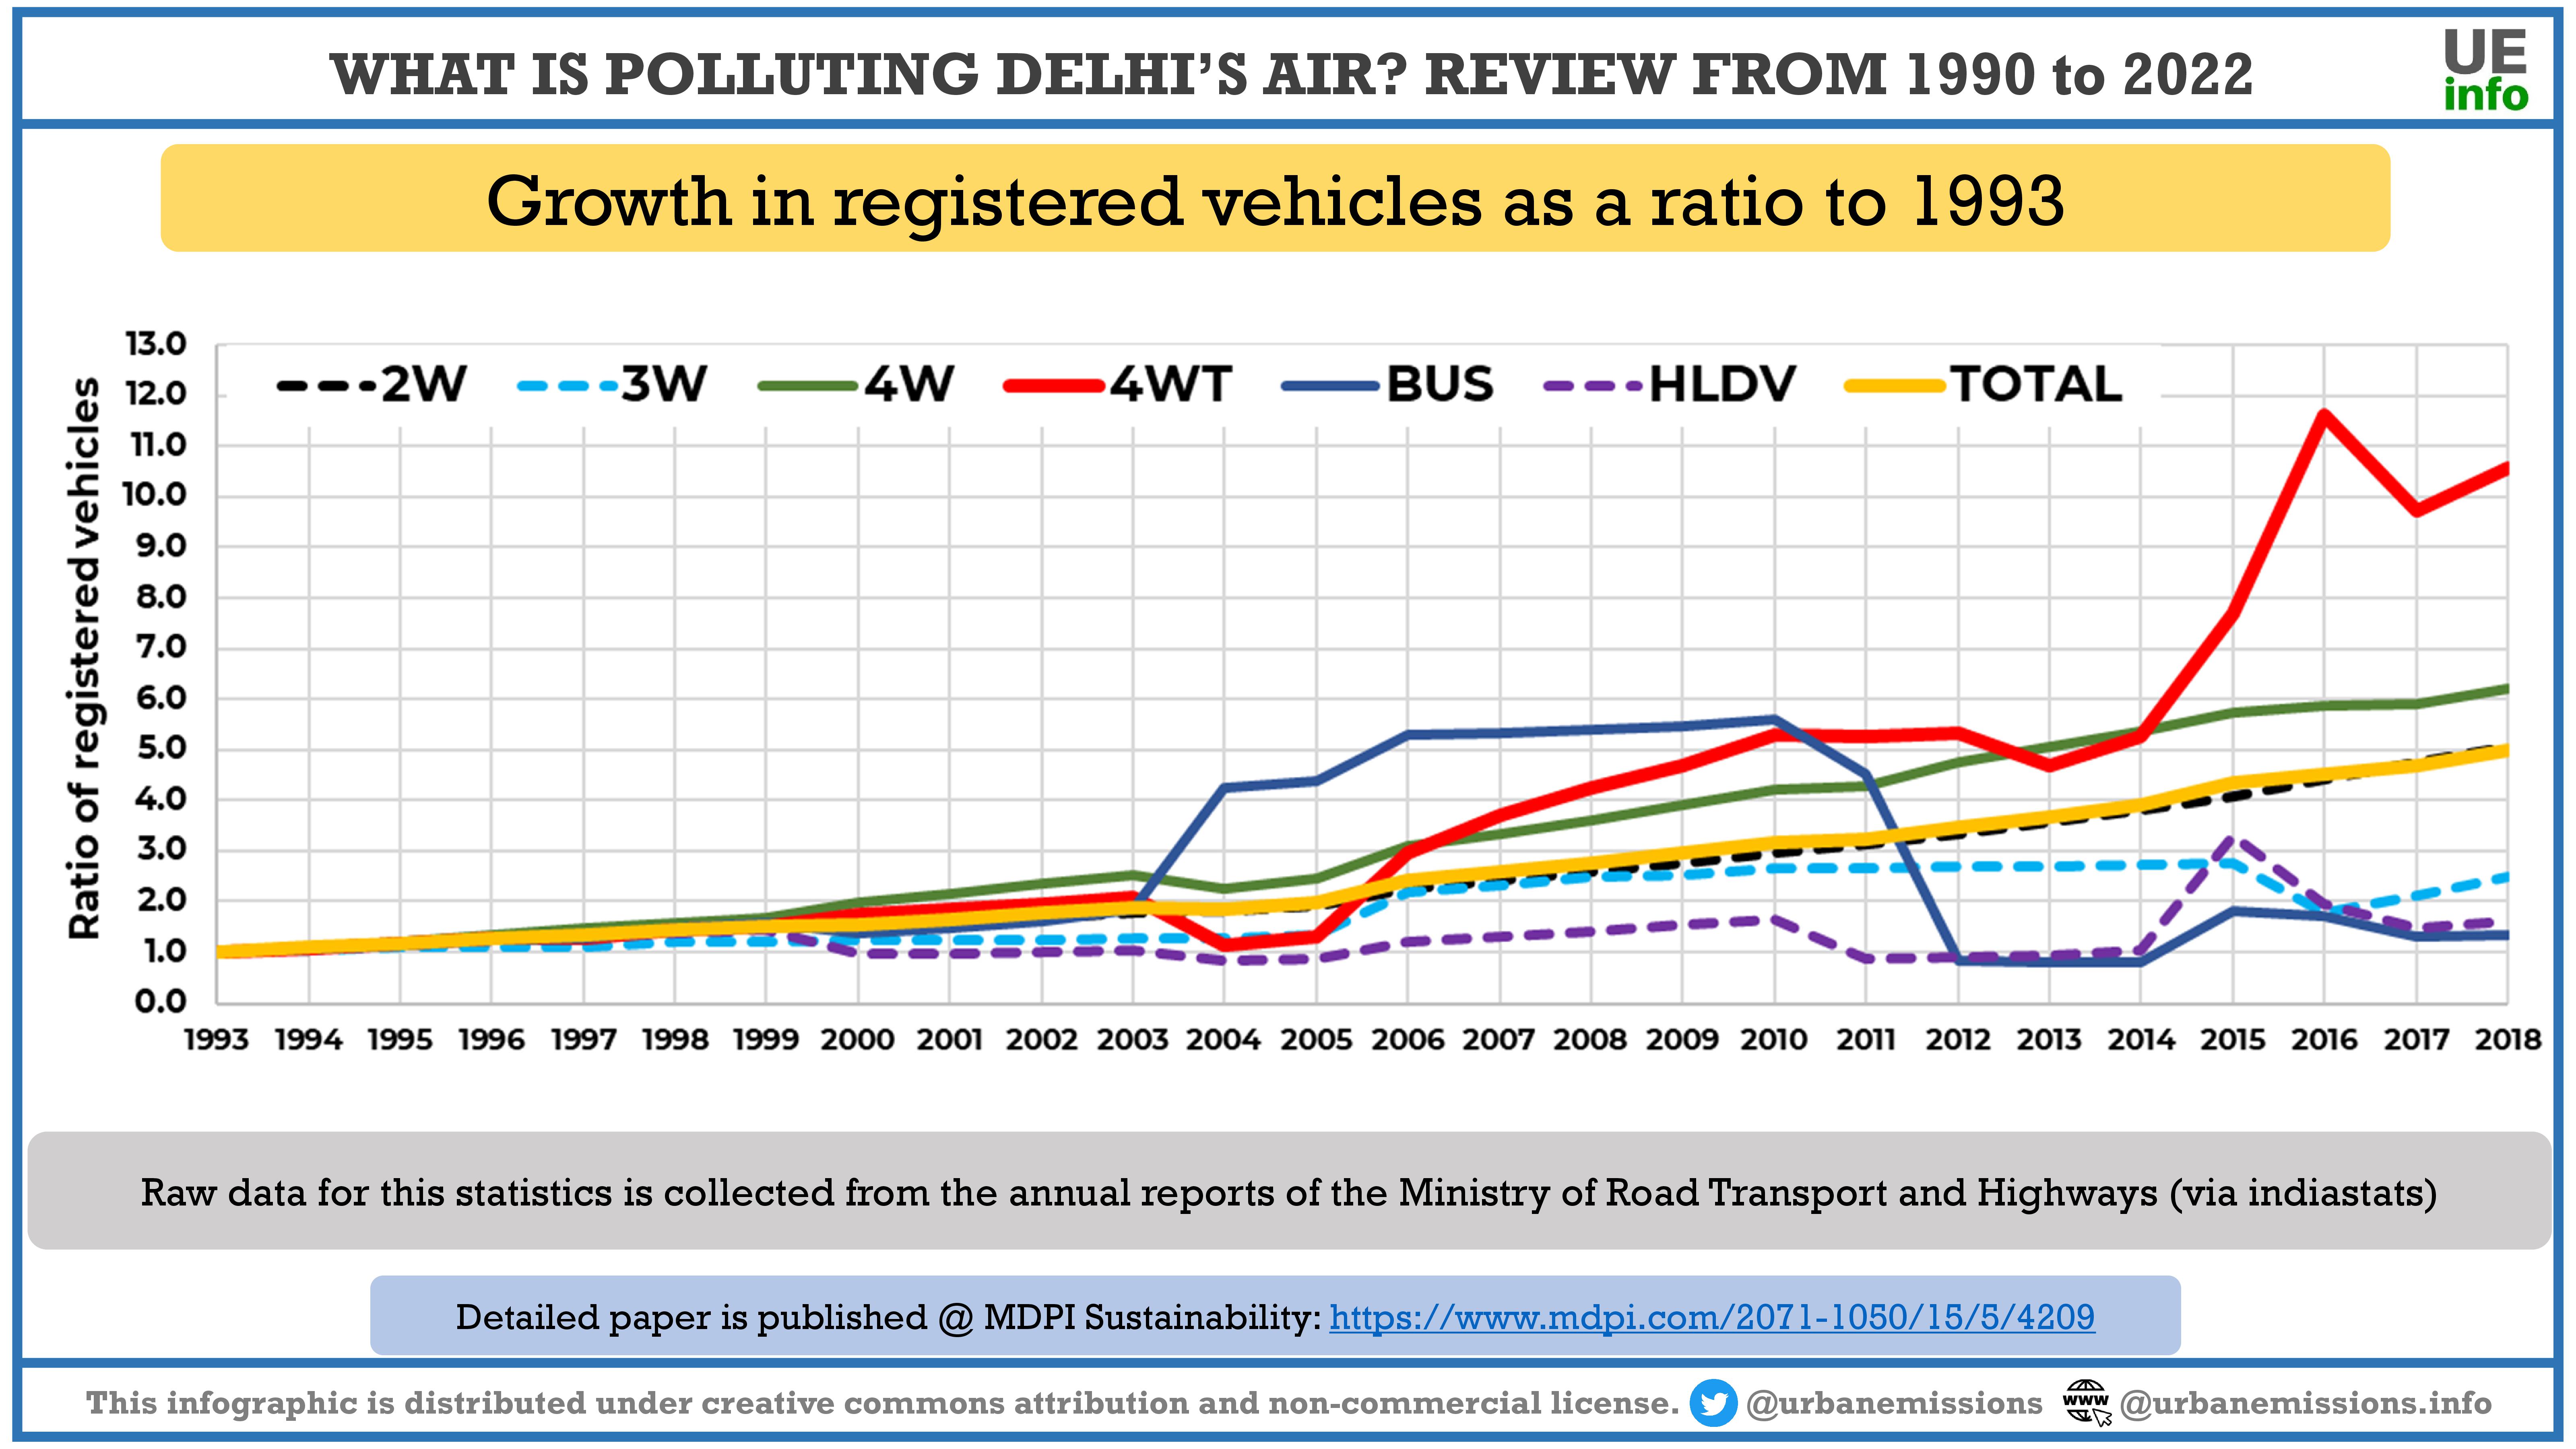
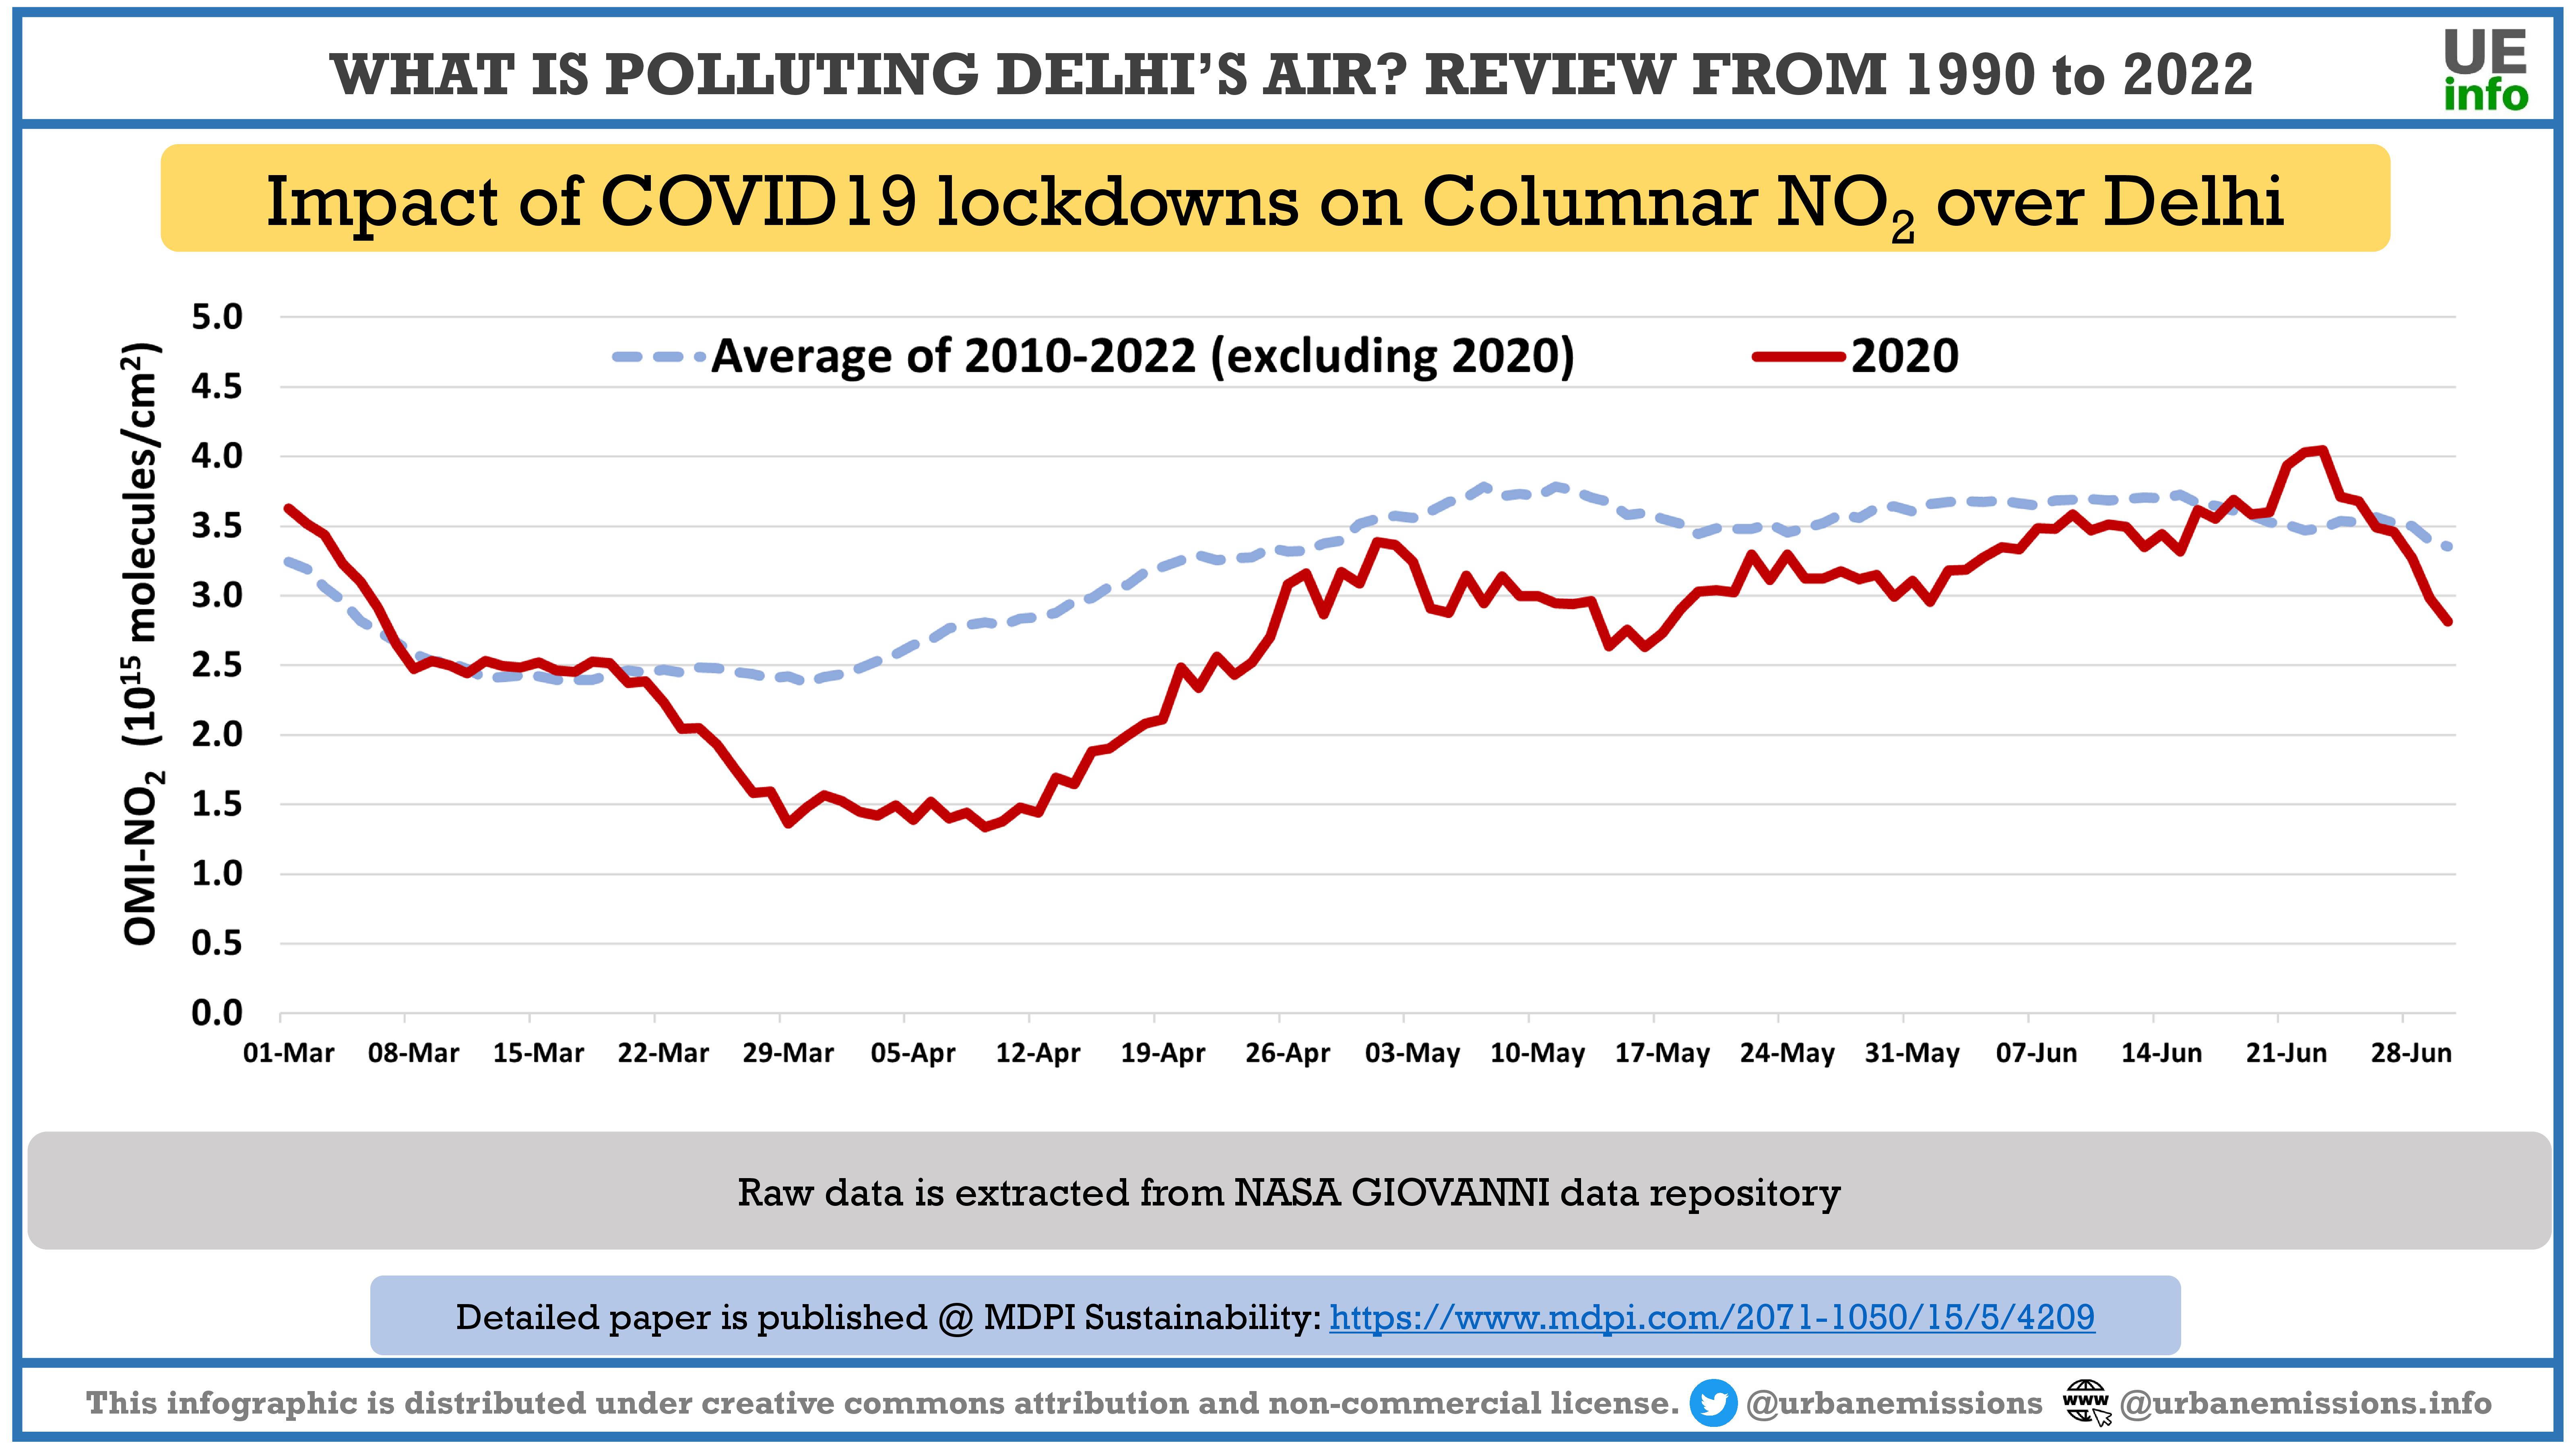
- EGU 2024 – What is Polluting Delhi’s Air? A Quantitative Review from 1990 to 2022 (download)
- IGAC 2024 – Uncertainty of Operating Smaller Number of Ambient Monitoring Stations: Indian Cities from 2015 to 2023 (download)
- IGAC 2024 – Evaluation of Ozone Exceedances and NOx-VOC Regimes in Delhi using Ground Measurements and TROPOMI Satellite Extracts (download)
- Infographics on Delhi’s Air Quality
- What’s polluting Delhi’s air? Review from 1990 to 2022 – 1/12: Annual PM2.5 measurements (download) (more here)
- What’s polluting Delhi’s air? Review from 1990 to 2022 – 2/12: Monthly PM2.5 measurements (download)
- What’s polluting Delhi’s air? Review from 1990 to 2022 – 3/12: Annual reanalysis PM2.5 concentrations (download)
- What’s polluting Delhi’s air? Review from 1990 to 2022 – 4/12: Introduction of Bharat standards (download)
- What’s polluting Delhi’s air? Review from 1990 to 2022 – 5/12: PM2.5 source contributions (download)
- What’s polluting Delhi’s air? Review from 1990 to 2022 – 6/12: Demography and Economics (download)
- What’s polluting Delhi’s air? Review from 1990 to 2022 – 7/12: Growth in urban area (download)
- What’s polluting Delhi’s air? Review from 1990 to 2022 – 8/12: Growth in vehicle registrations (download)
- What’s polluting Delhi’s air? Review from 1990 to 2022 – 9/12: Monthly electricity demand (download)
- What’s polluting Delhi’s air? Review from 1990 to 2022 – 10/12: Impact of COVID19 lockdowns on AOD (download)
- What’s polluting Delhi’s air? Review from 1990 to 2022 – 11/12: Impact of COVID19 lockdowns on NO2 (download)
- What’s polluting Delhi’s air? Review from 1990 to 2022 – 12/12: Impact of COVID19 lockdowns on electricity demand (download)
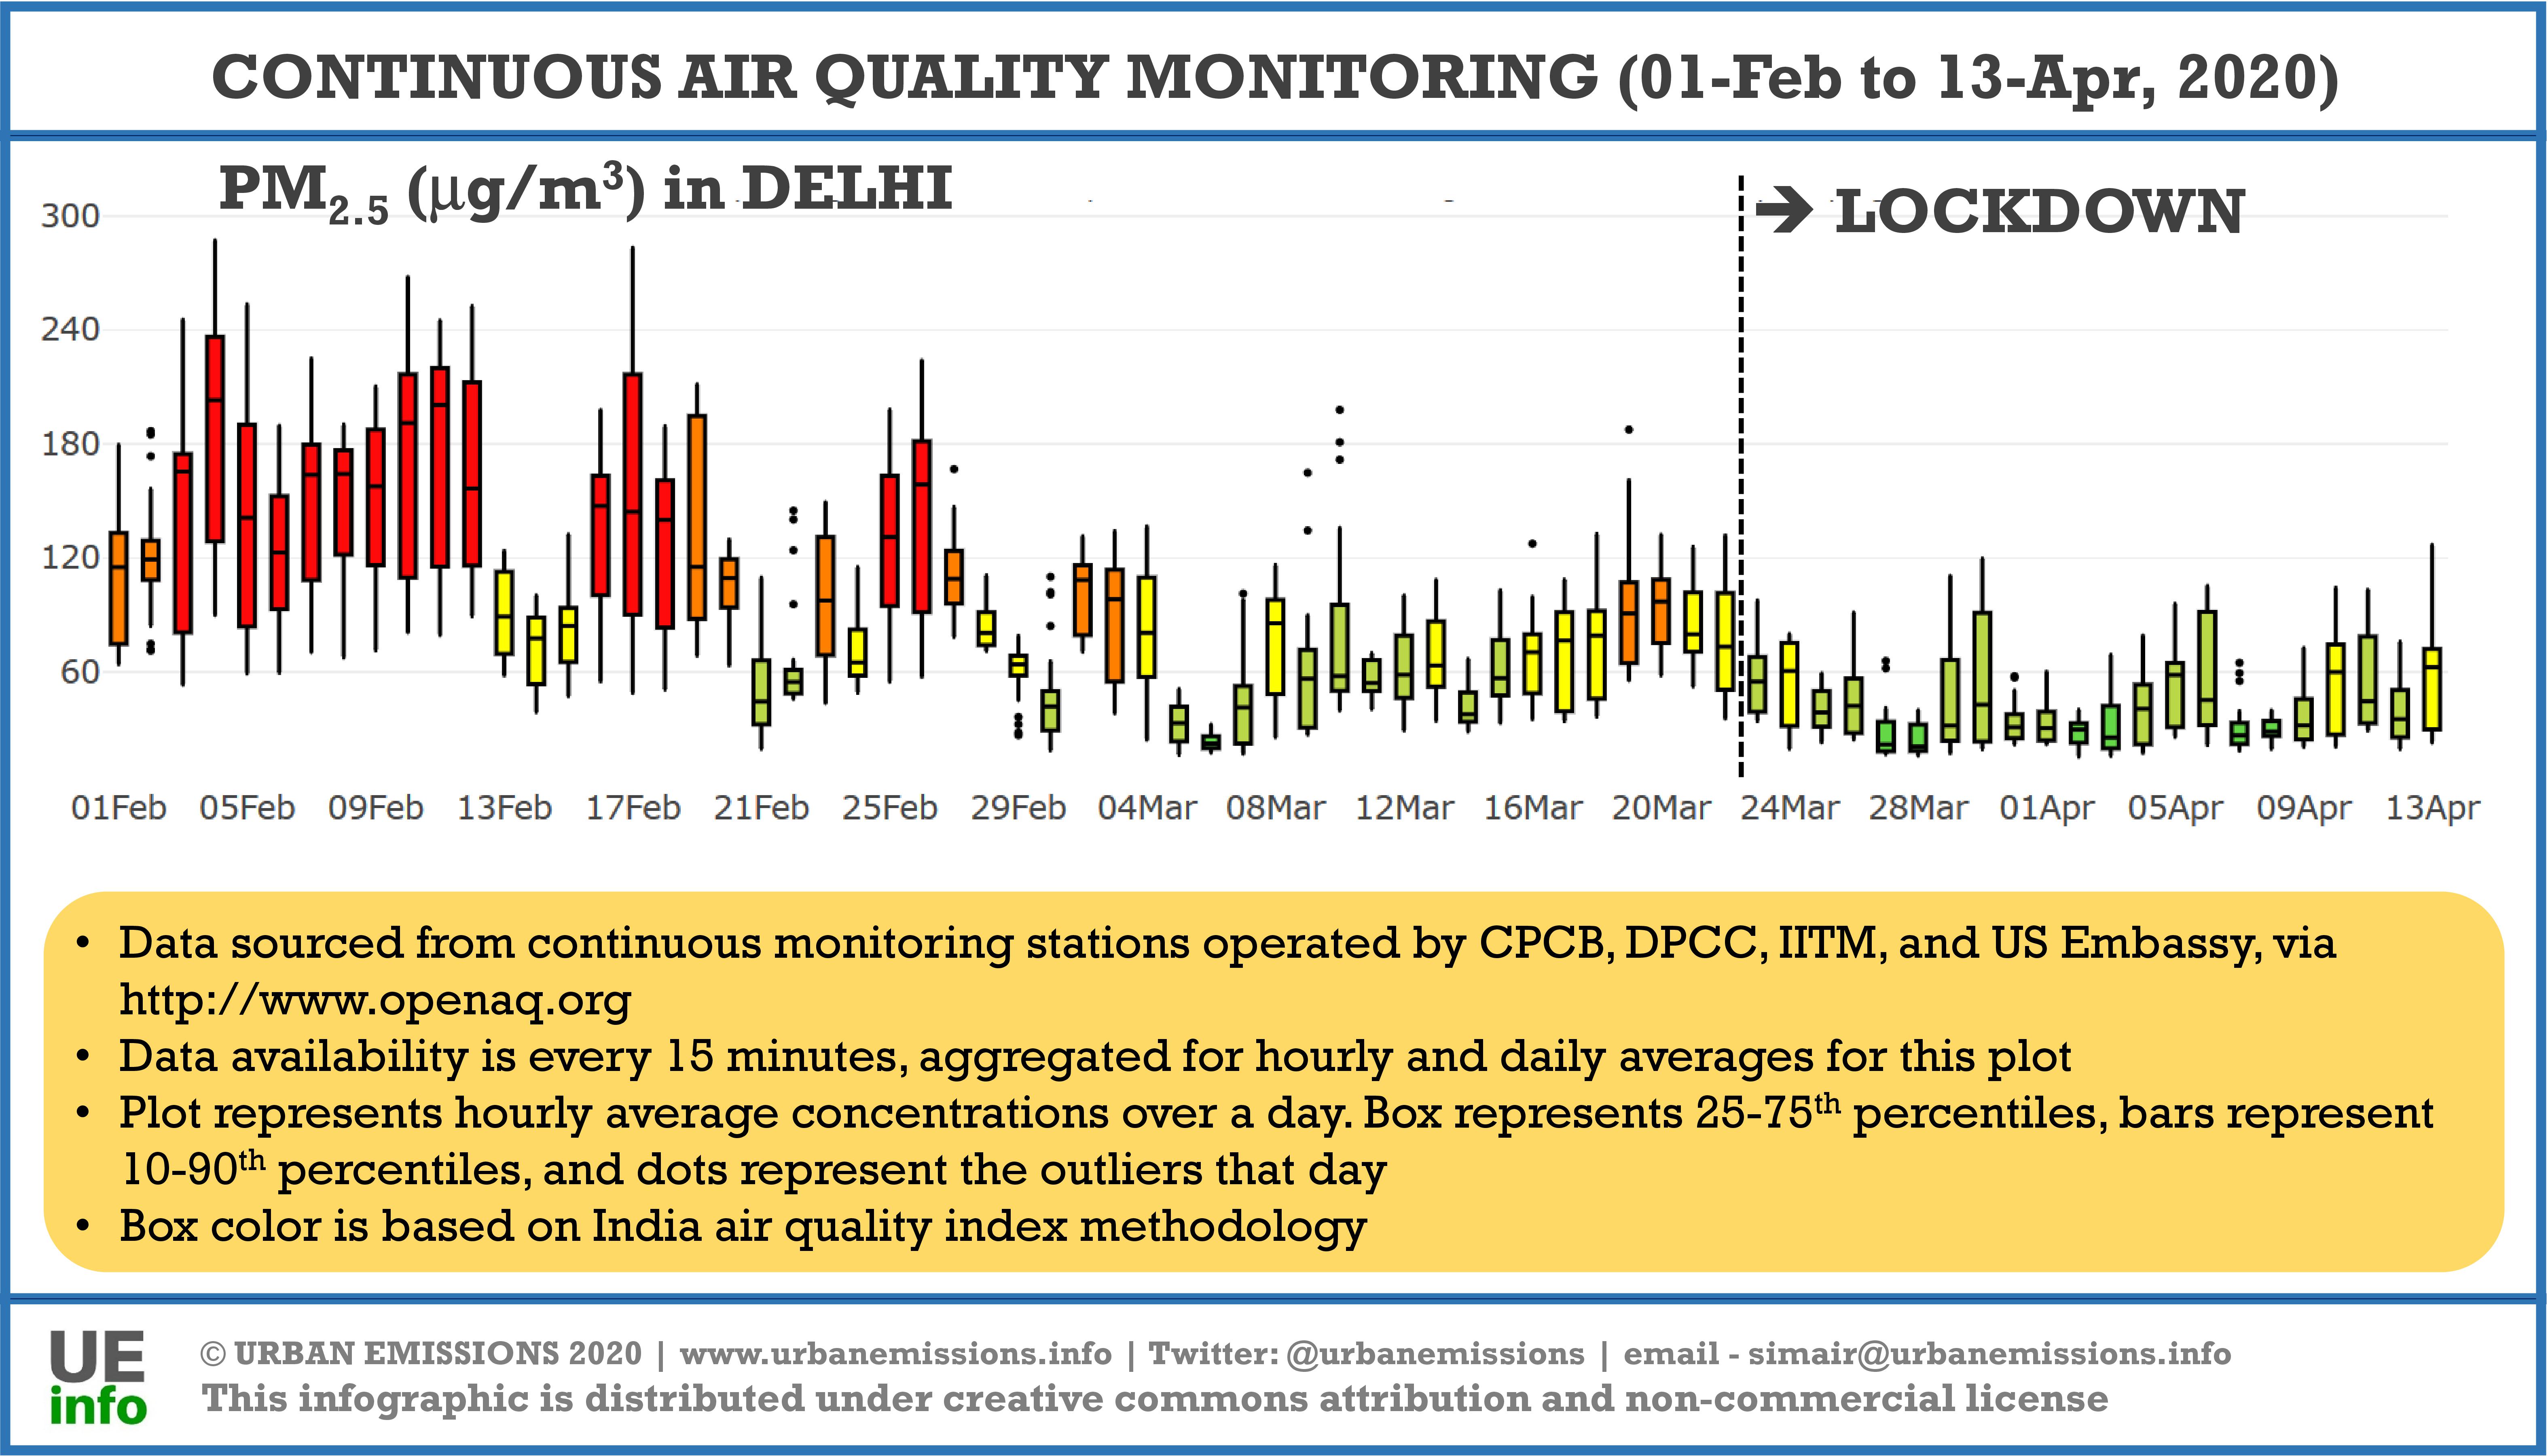
- Change in PM2.5 concentrations during 2020 COVID19 lockdowns in Delhi (download)
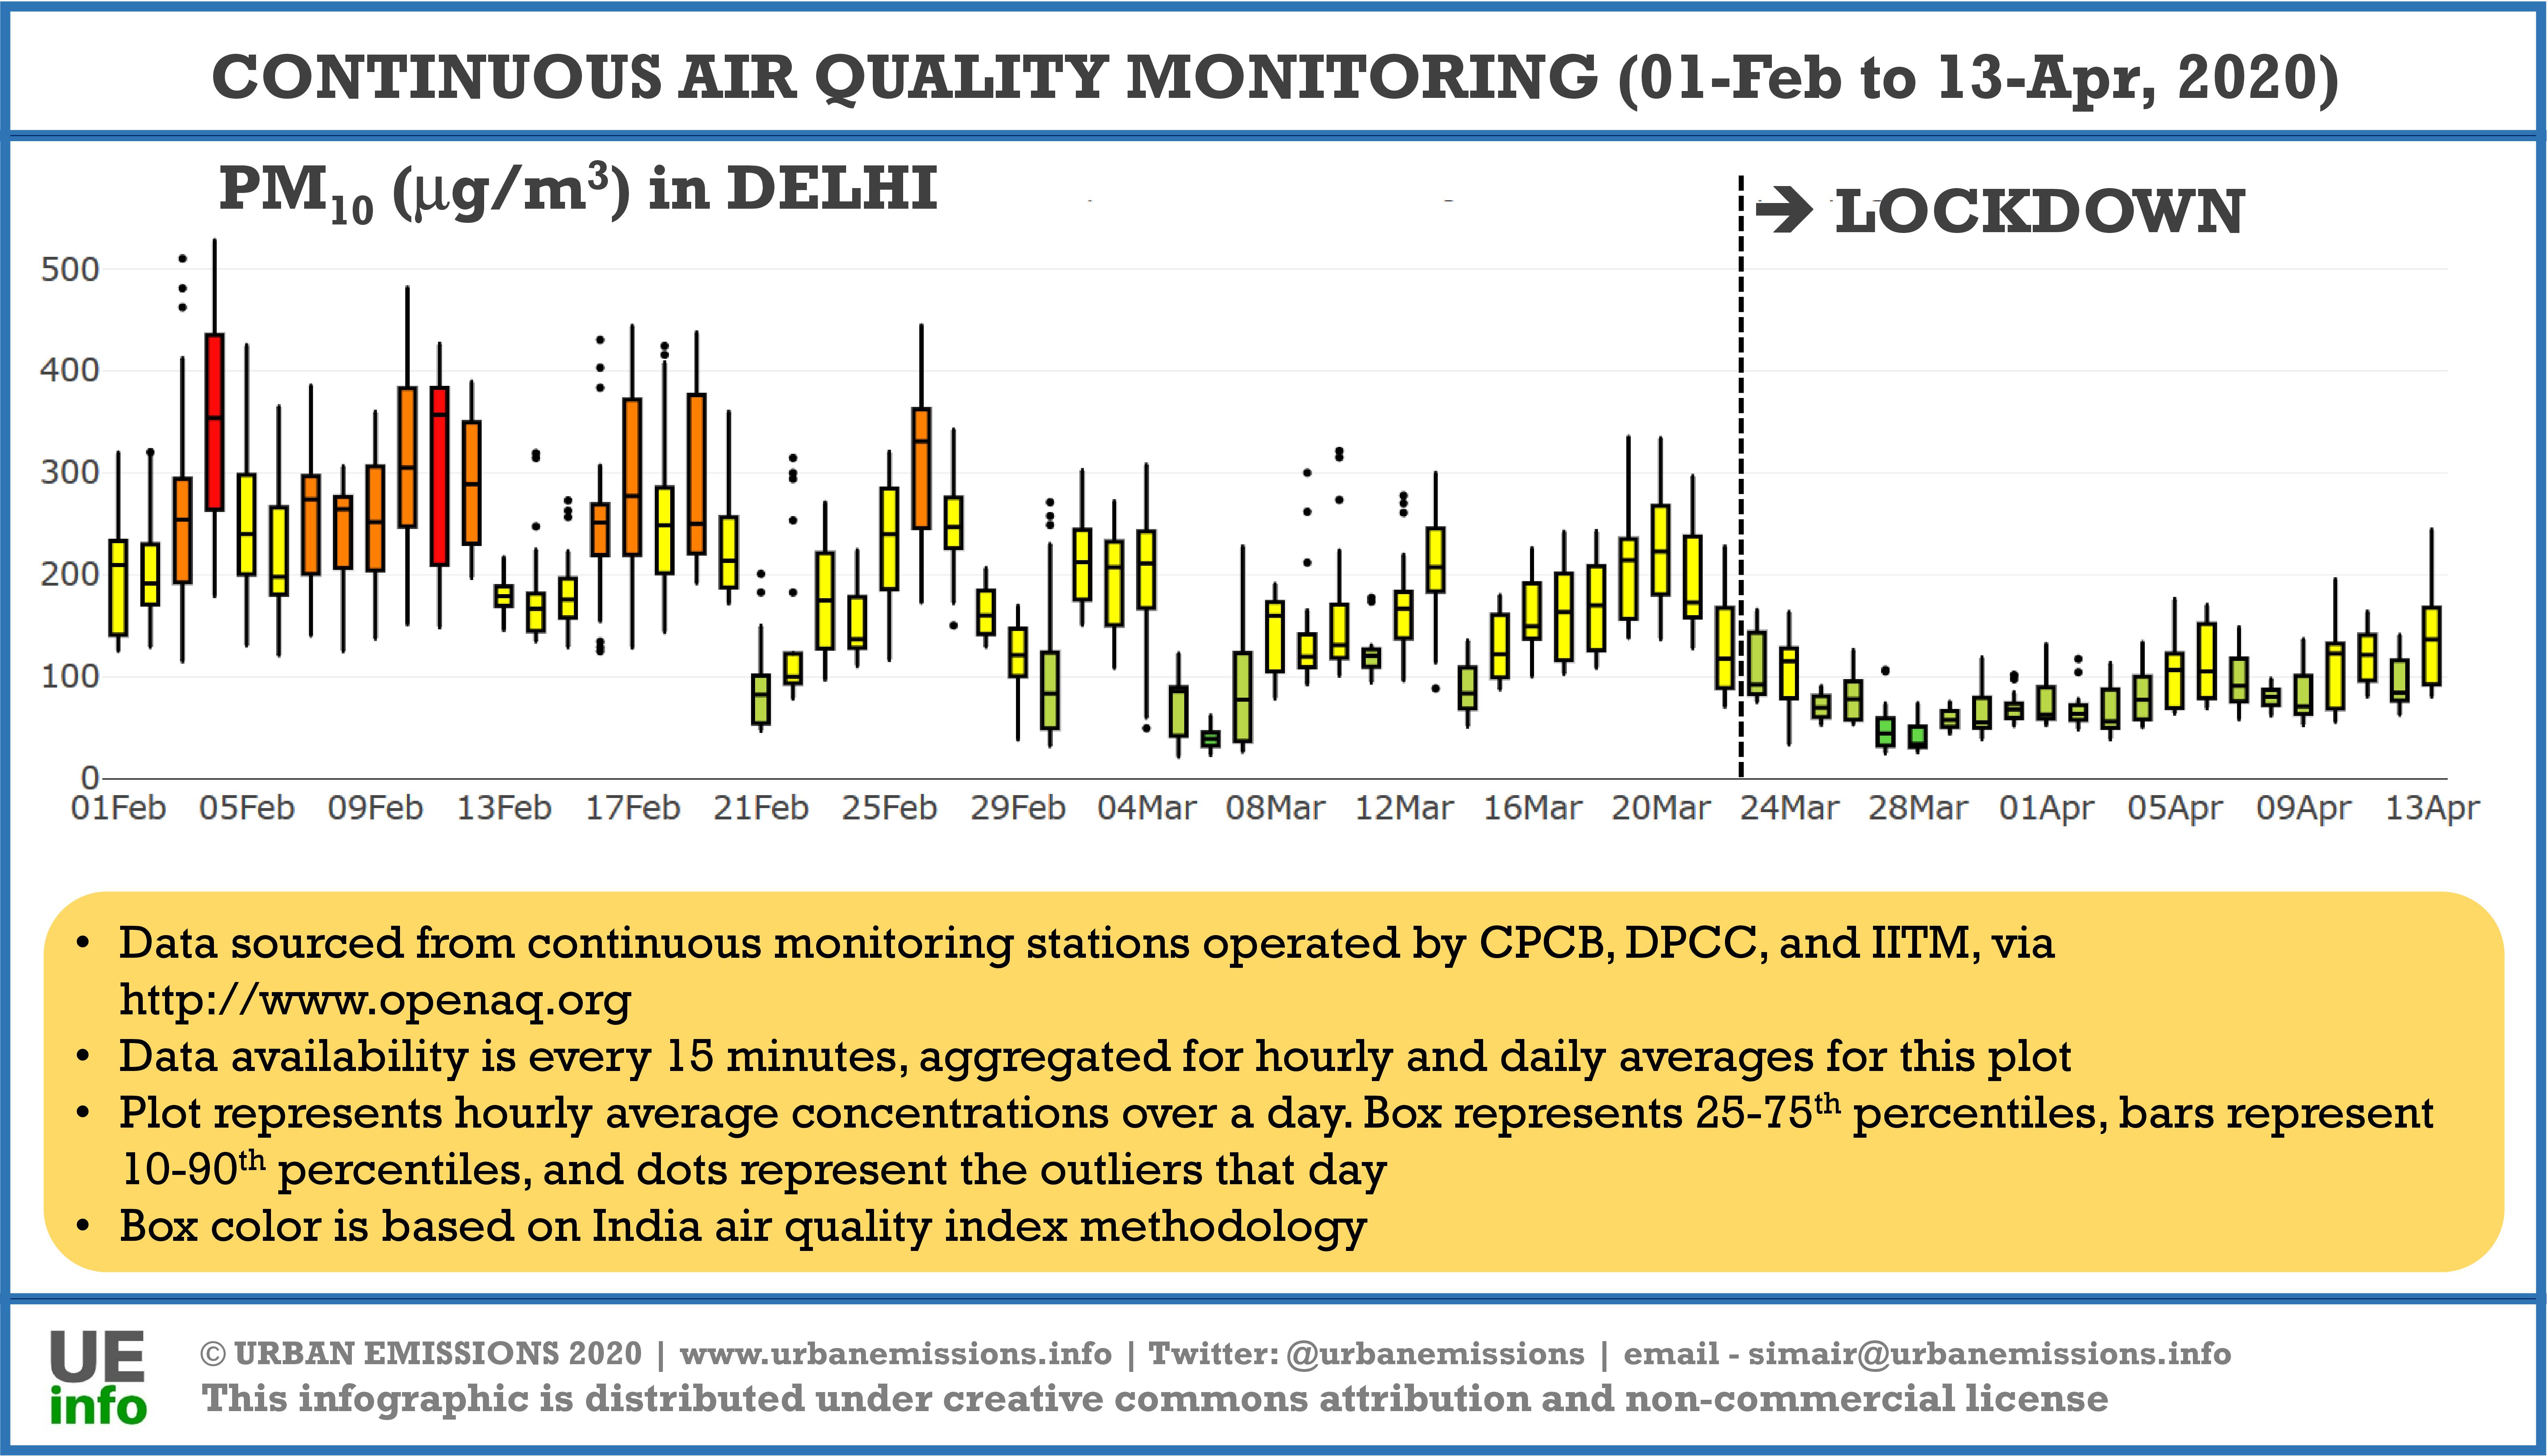
- Change in PM10 concentrations during 2020 COVID19 lockdowns in Delhi (download)
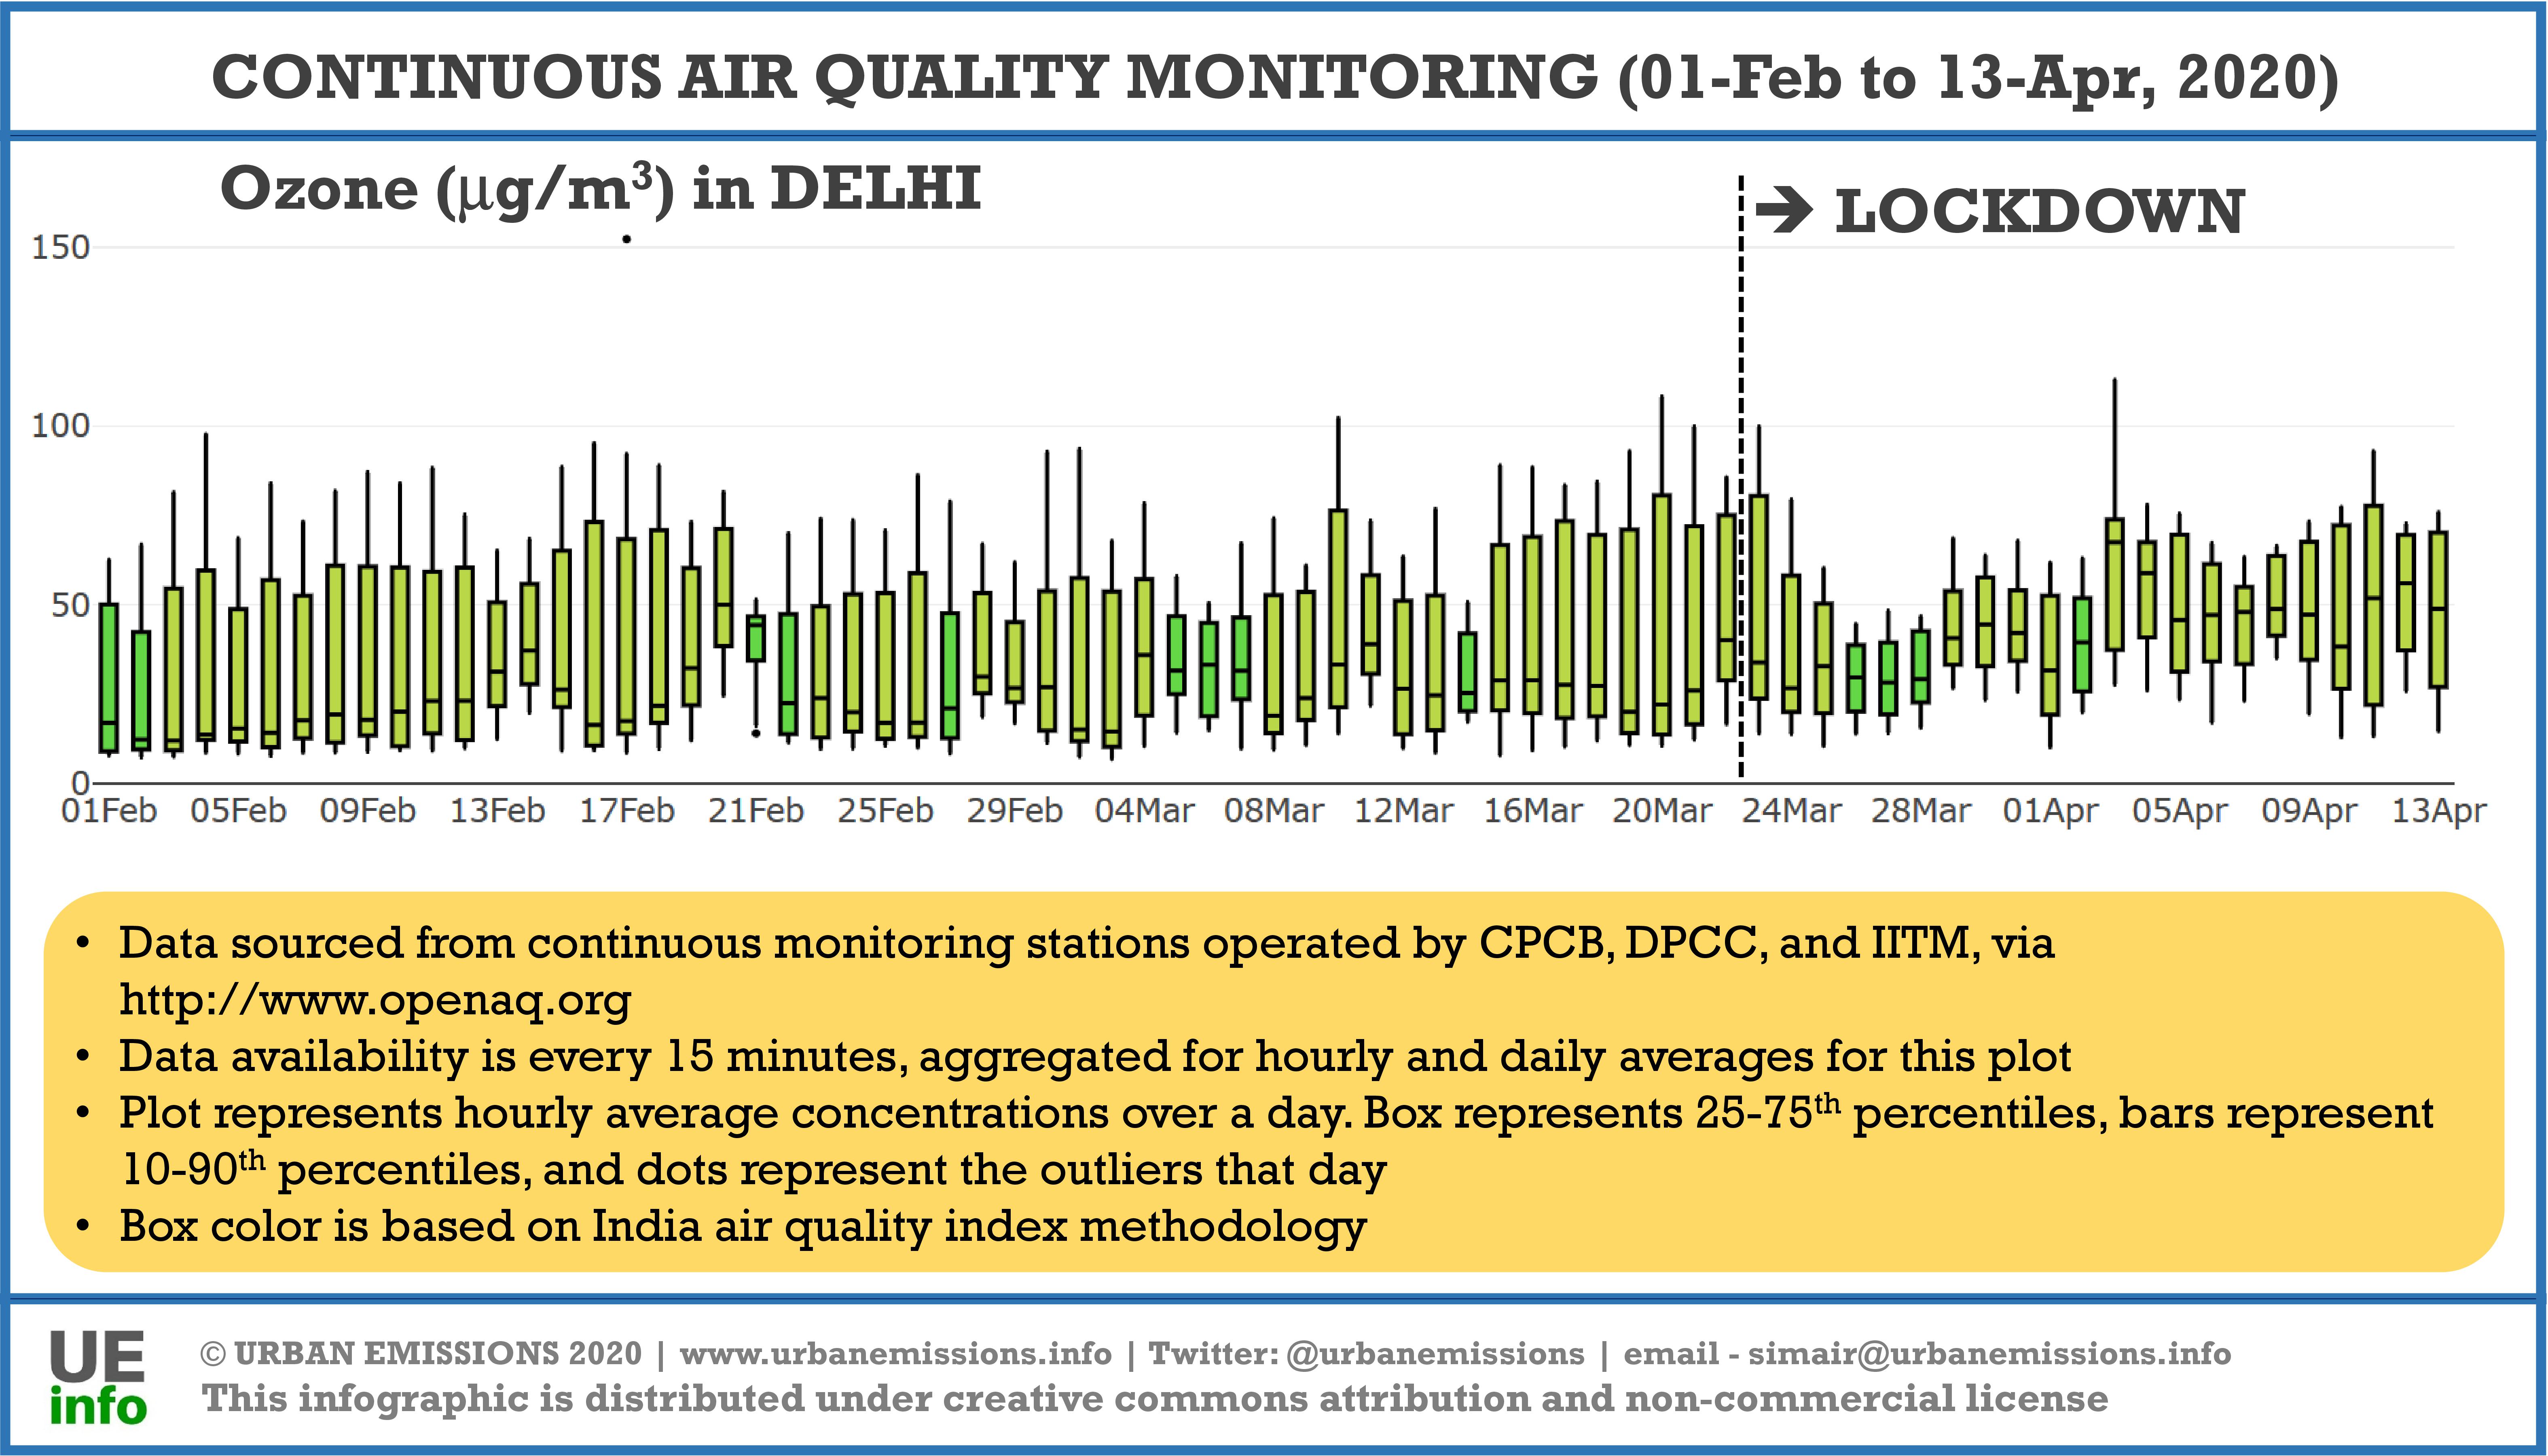
- Change in Ozone concentrations during 2020 COVID19 lockdowns in Delhi (download)
- Change in SO2 concentrations during 2020 COVID19 lockdowns in Delhi (download)
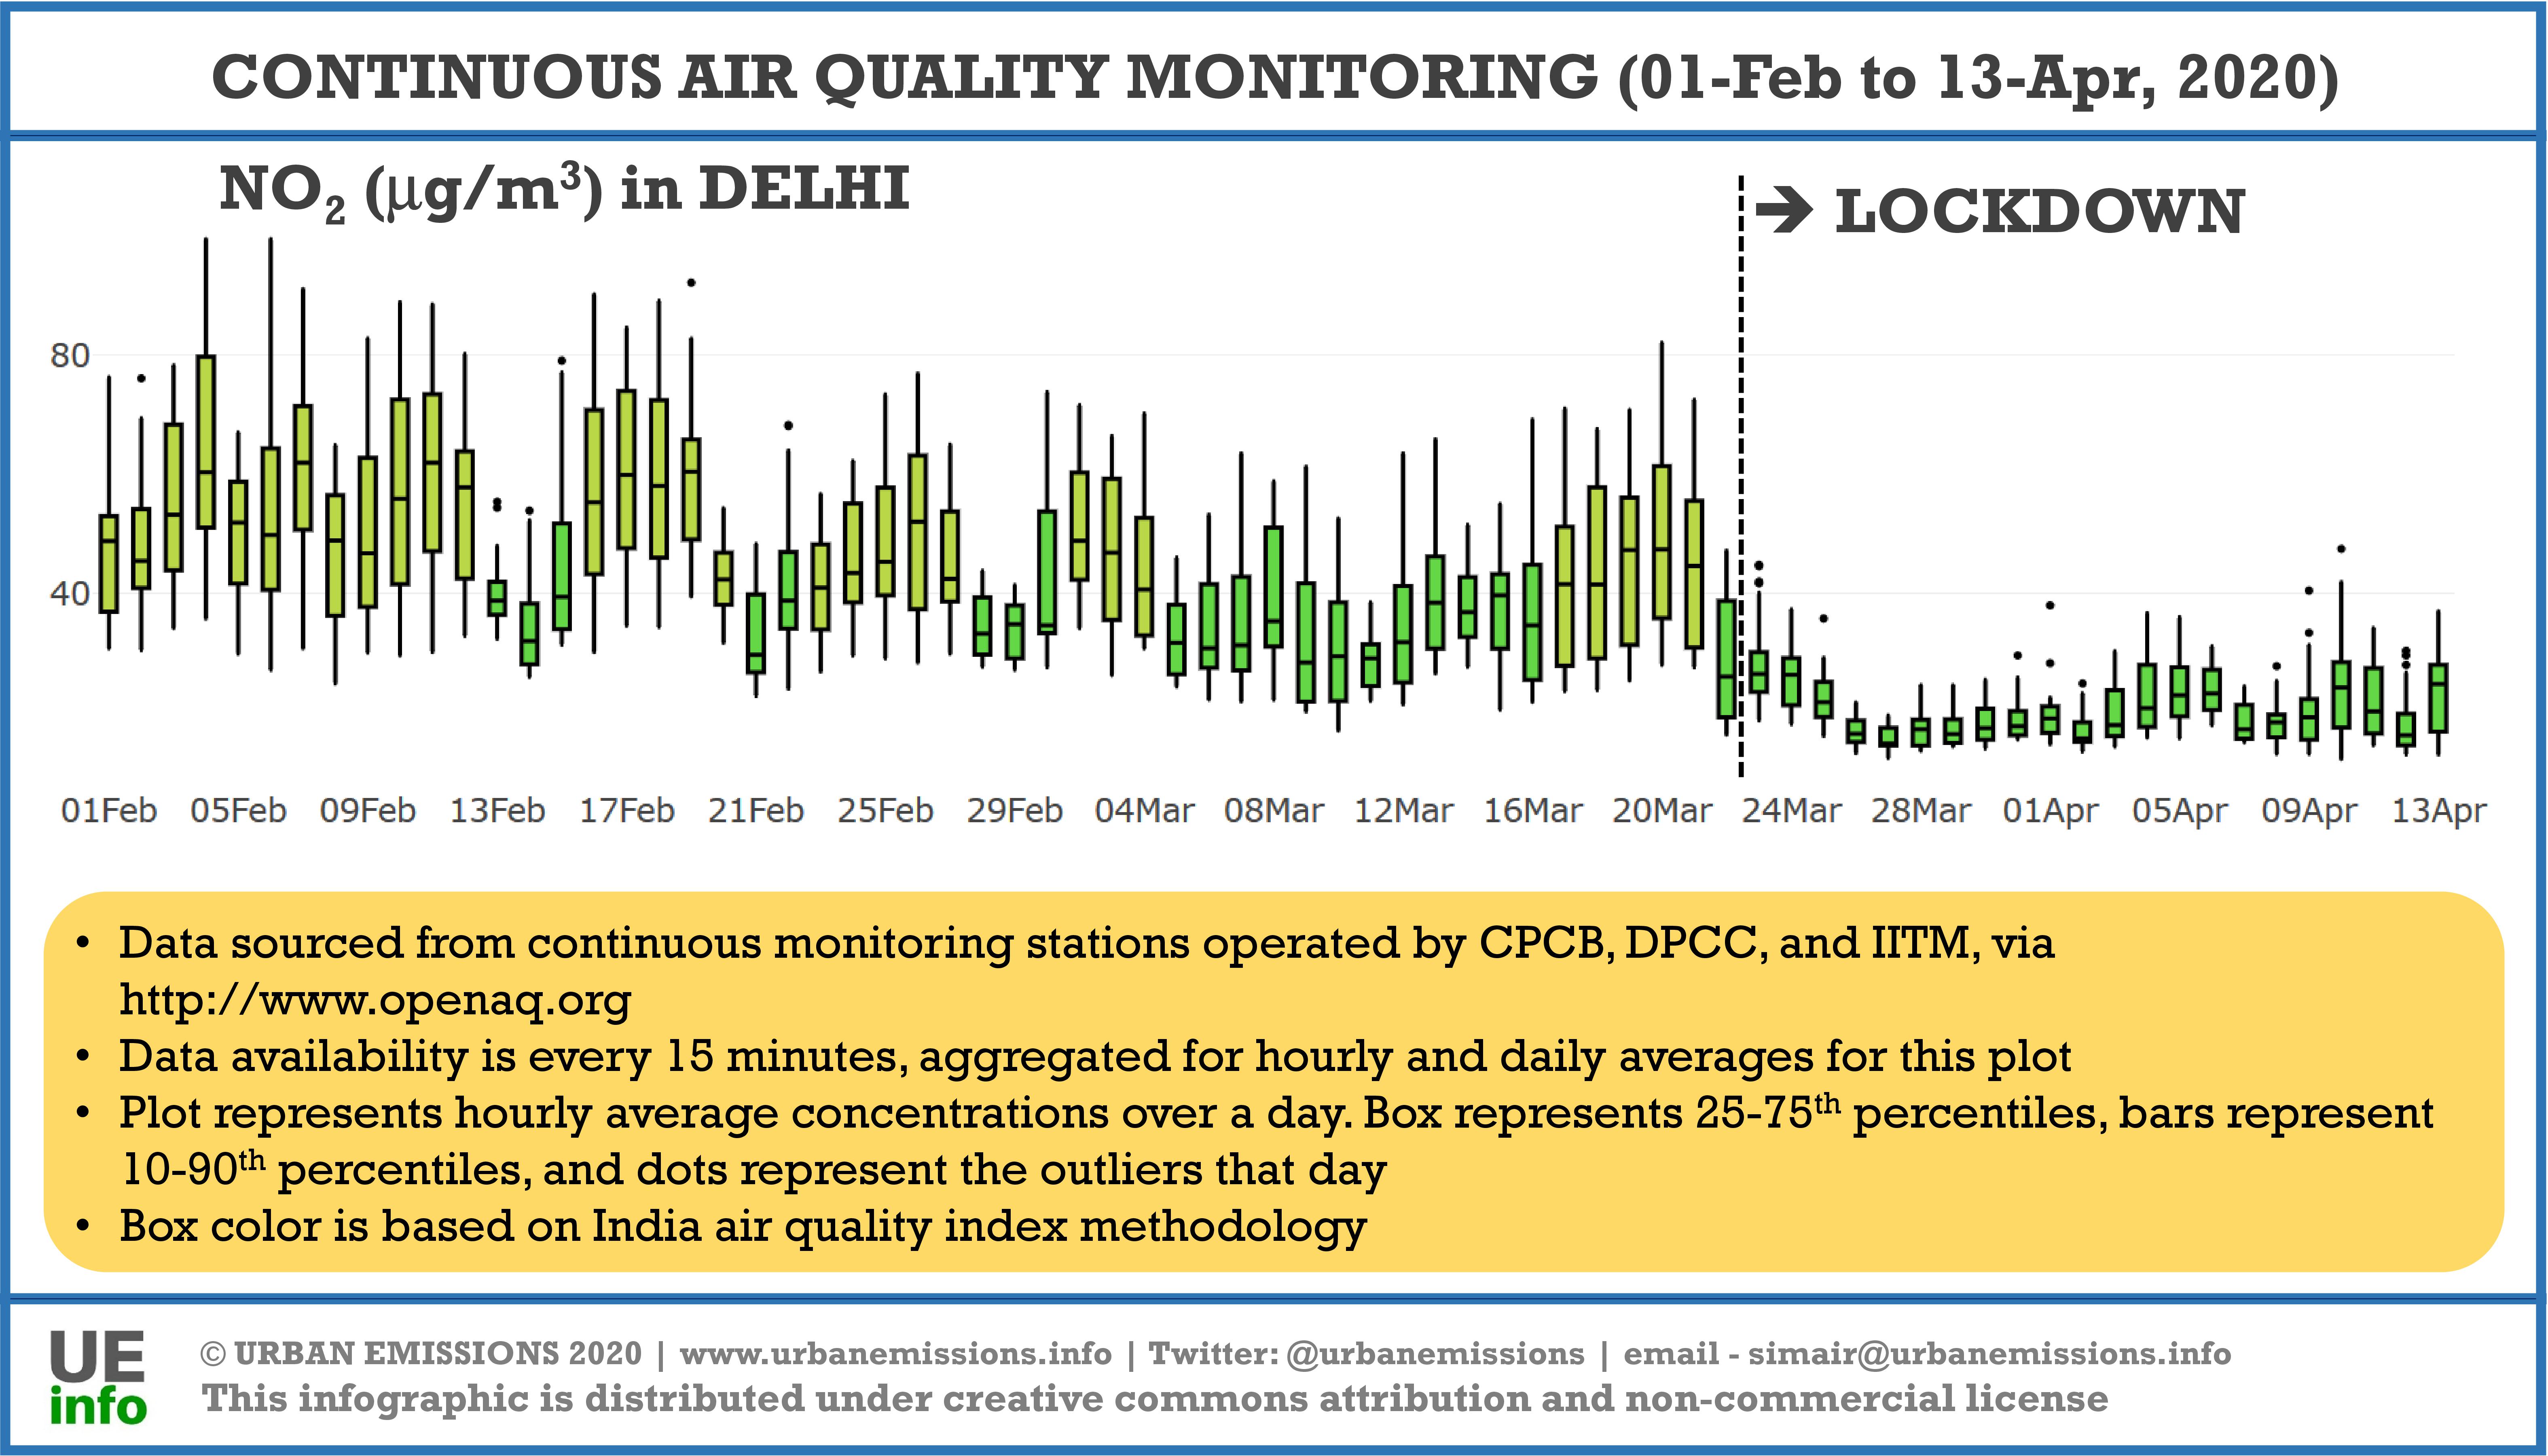
 Change in NO2 concentrations during 2020 COVID19 lockdowns in Delhi (download)
- Change in CO concentrations during 2020 COVID19 lockdowns in Delhi (download)
- Minimum number of buses required to meet the passenger transport demand in Delhi during the odd-even experiment in 2019, assuming that 50% of the motorcycles and 4-wheelers will be off the roads (download)
- PM2.5 pollution on the day of and day after Diwali in 2016, 2017, and 2018 (download)
- Summary of annual average PM2.5 concentrations from Delhi’s continuous monitoring network from 2006 to 2018 (download)
- Summary of daily average PM2.5 concentrations from Delhi’s continuous monitoring network from 2006 to 2018 (download)
- Summary of monthly average PM2.5 concentrations from Delhi’s continuous monitoring network from 2006 to 2018 (download)
- Summary of average surface temperatures in Delhi from its continuous monitoring network from 2006 to 2018 (download)
- Summary of change in the urban built-up area in Delhi’s airshed in 1975, 1990, 2000, and 2014 (download)
- Summary of average meteorology in Delhi’s airshed from WRF simulations for year 2015 – wind speeds, wind directions, mixing heights, and surface air temperature (download)
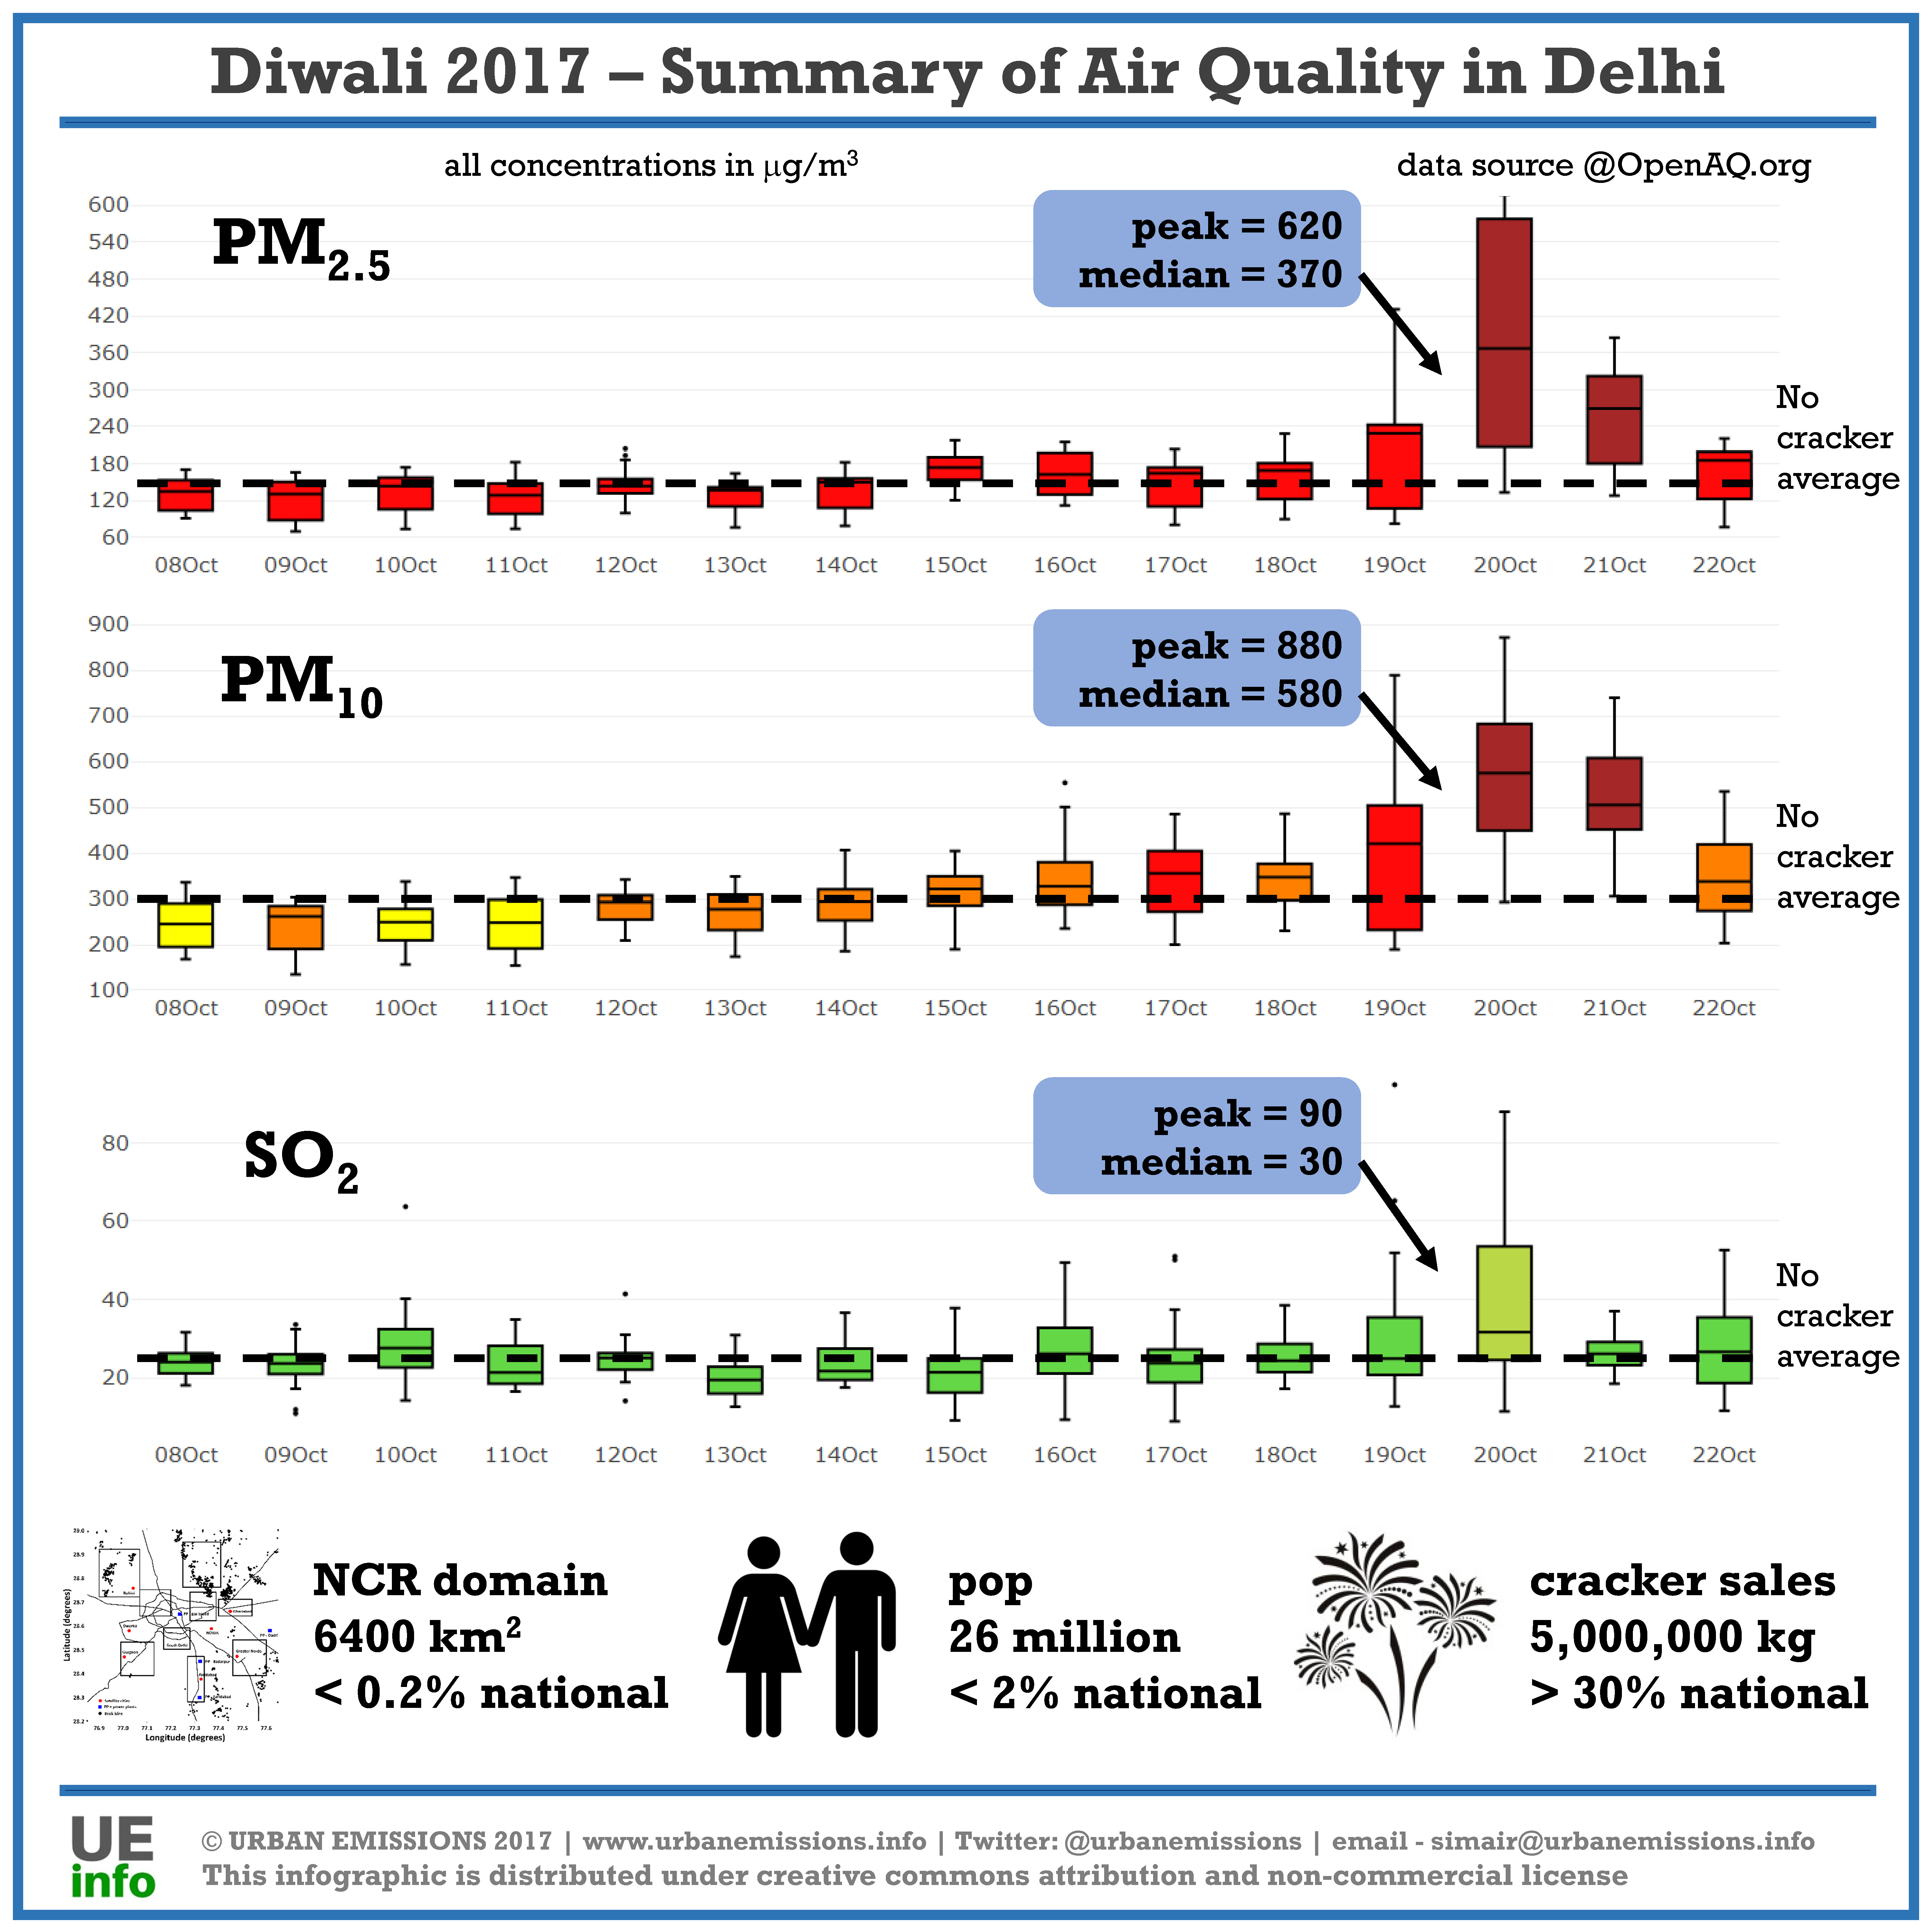
- Summary of PM2.5, SO2, and NO2 concentrations during 2017 Diwali (download)
- Comparing PM2.5 concentrations during 2016 and 2017 Diwali (download)
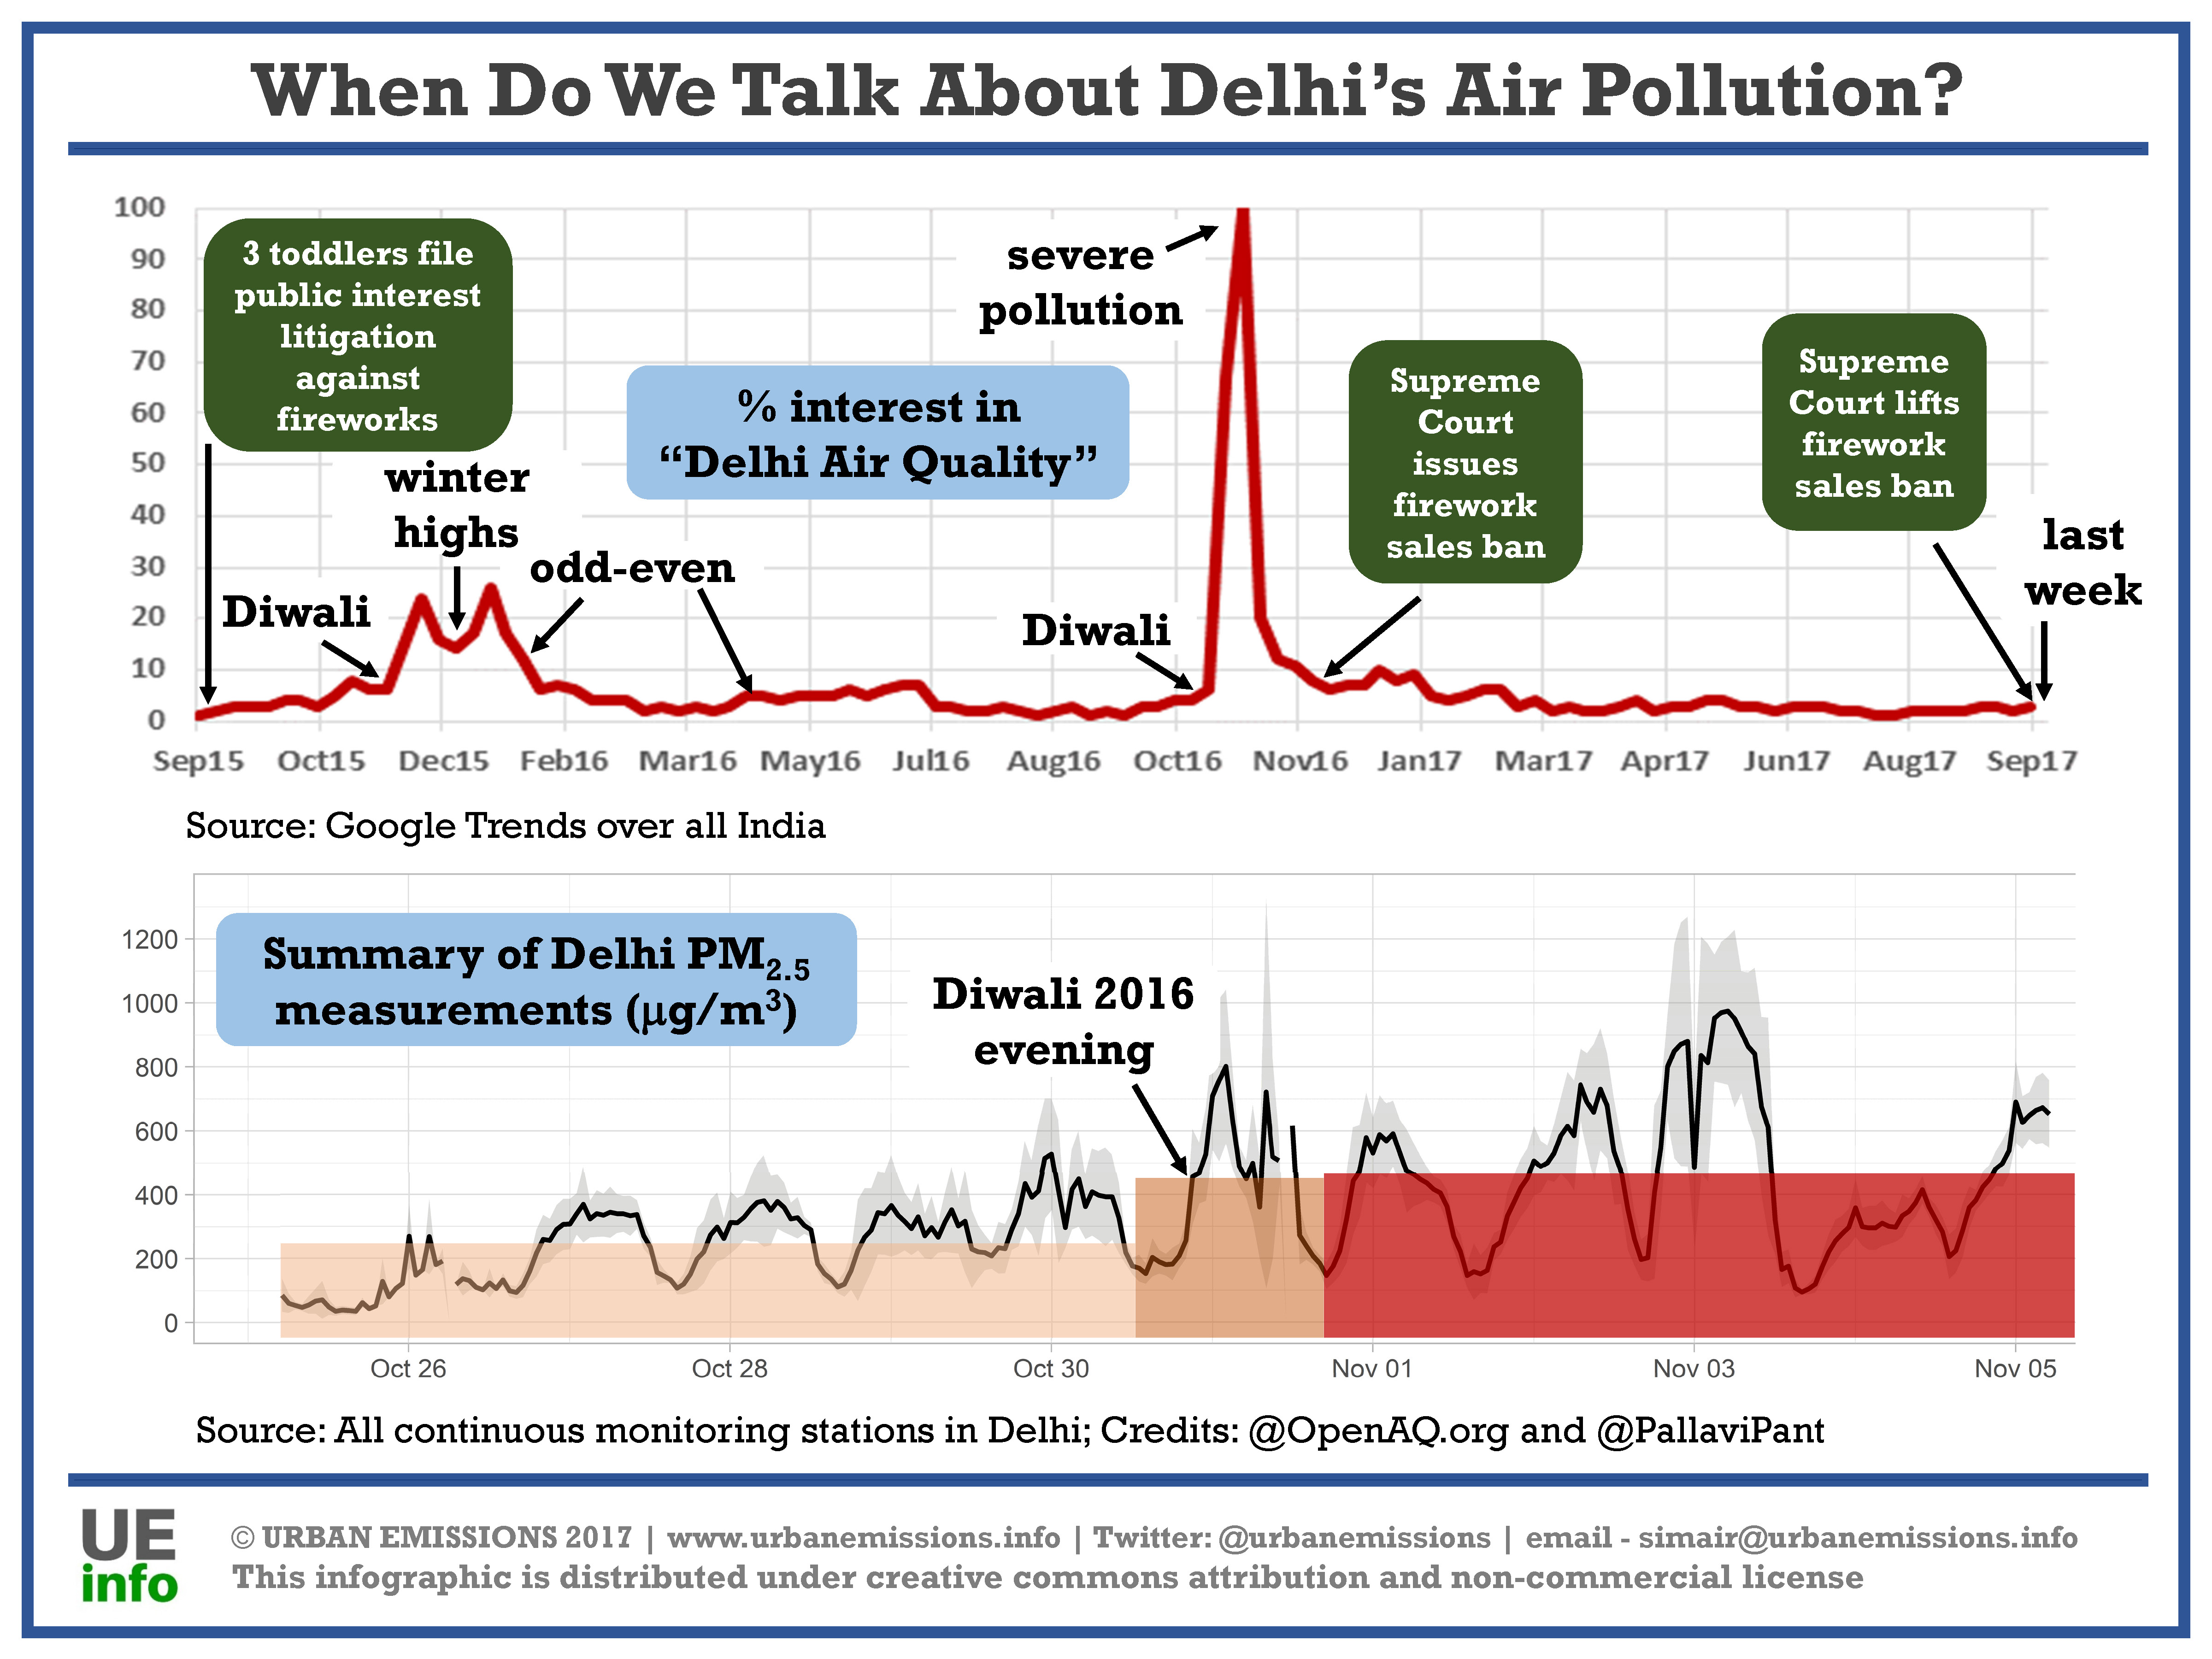
- When do we talk about Delhi’s air pollution – 2016 trend analysis (download)
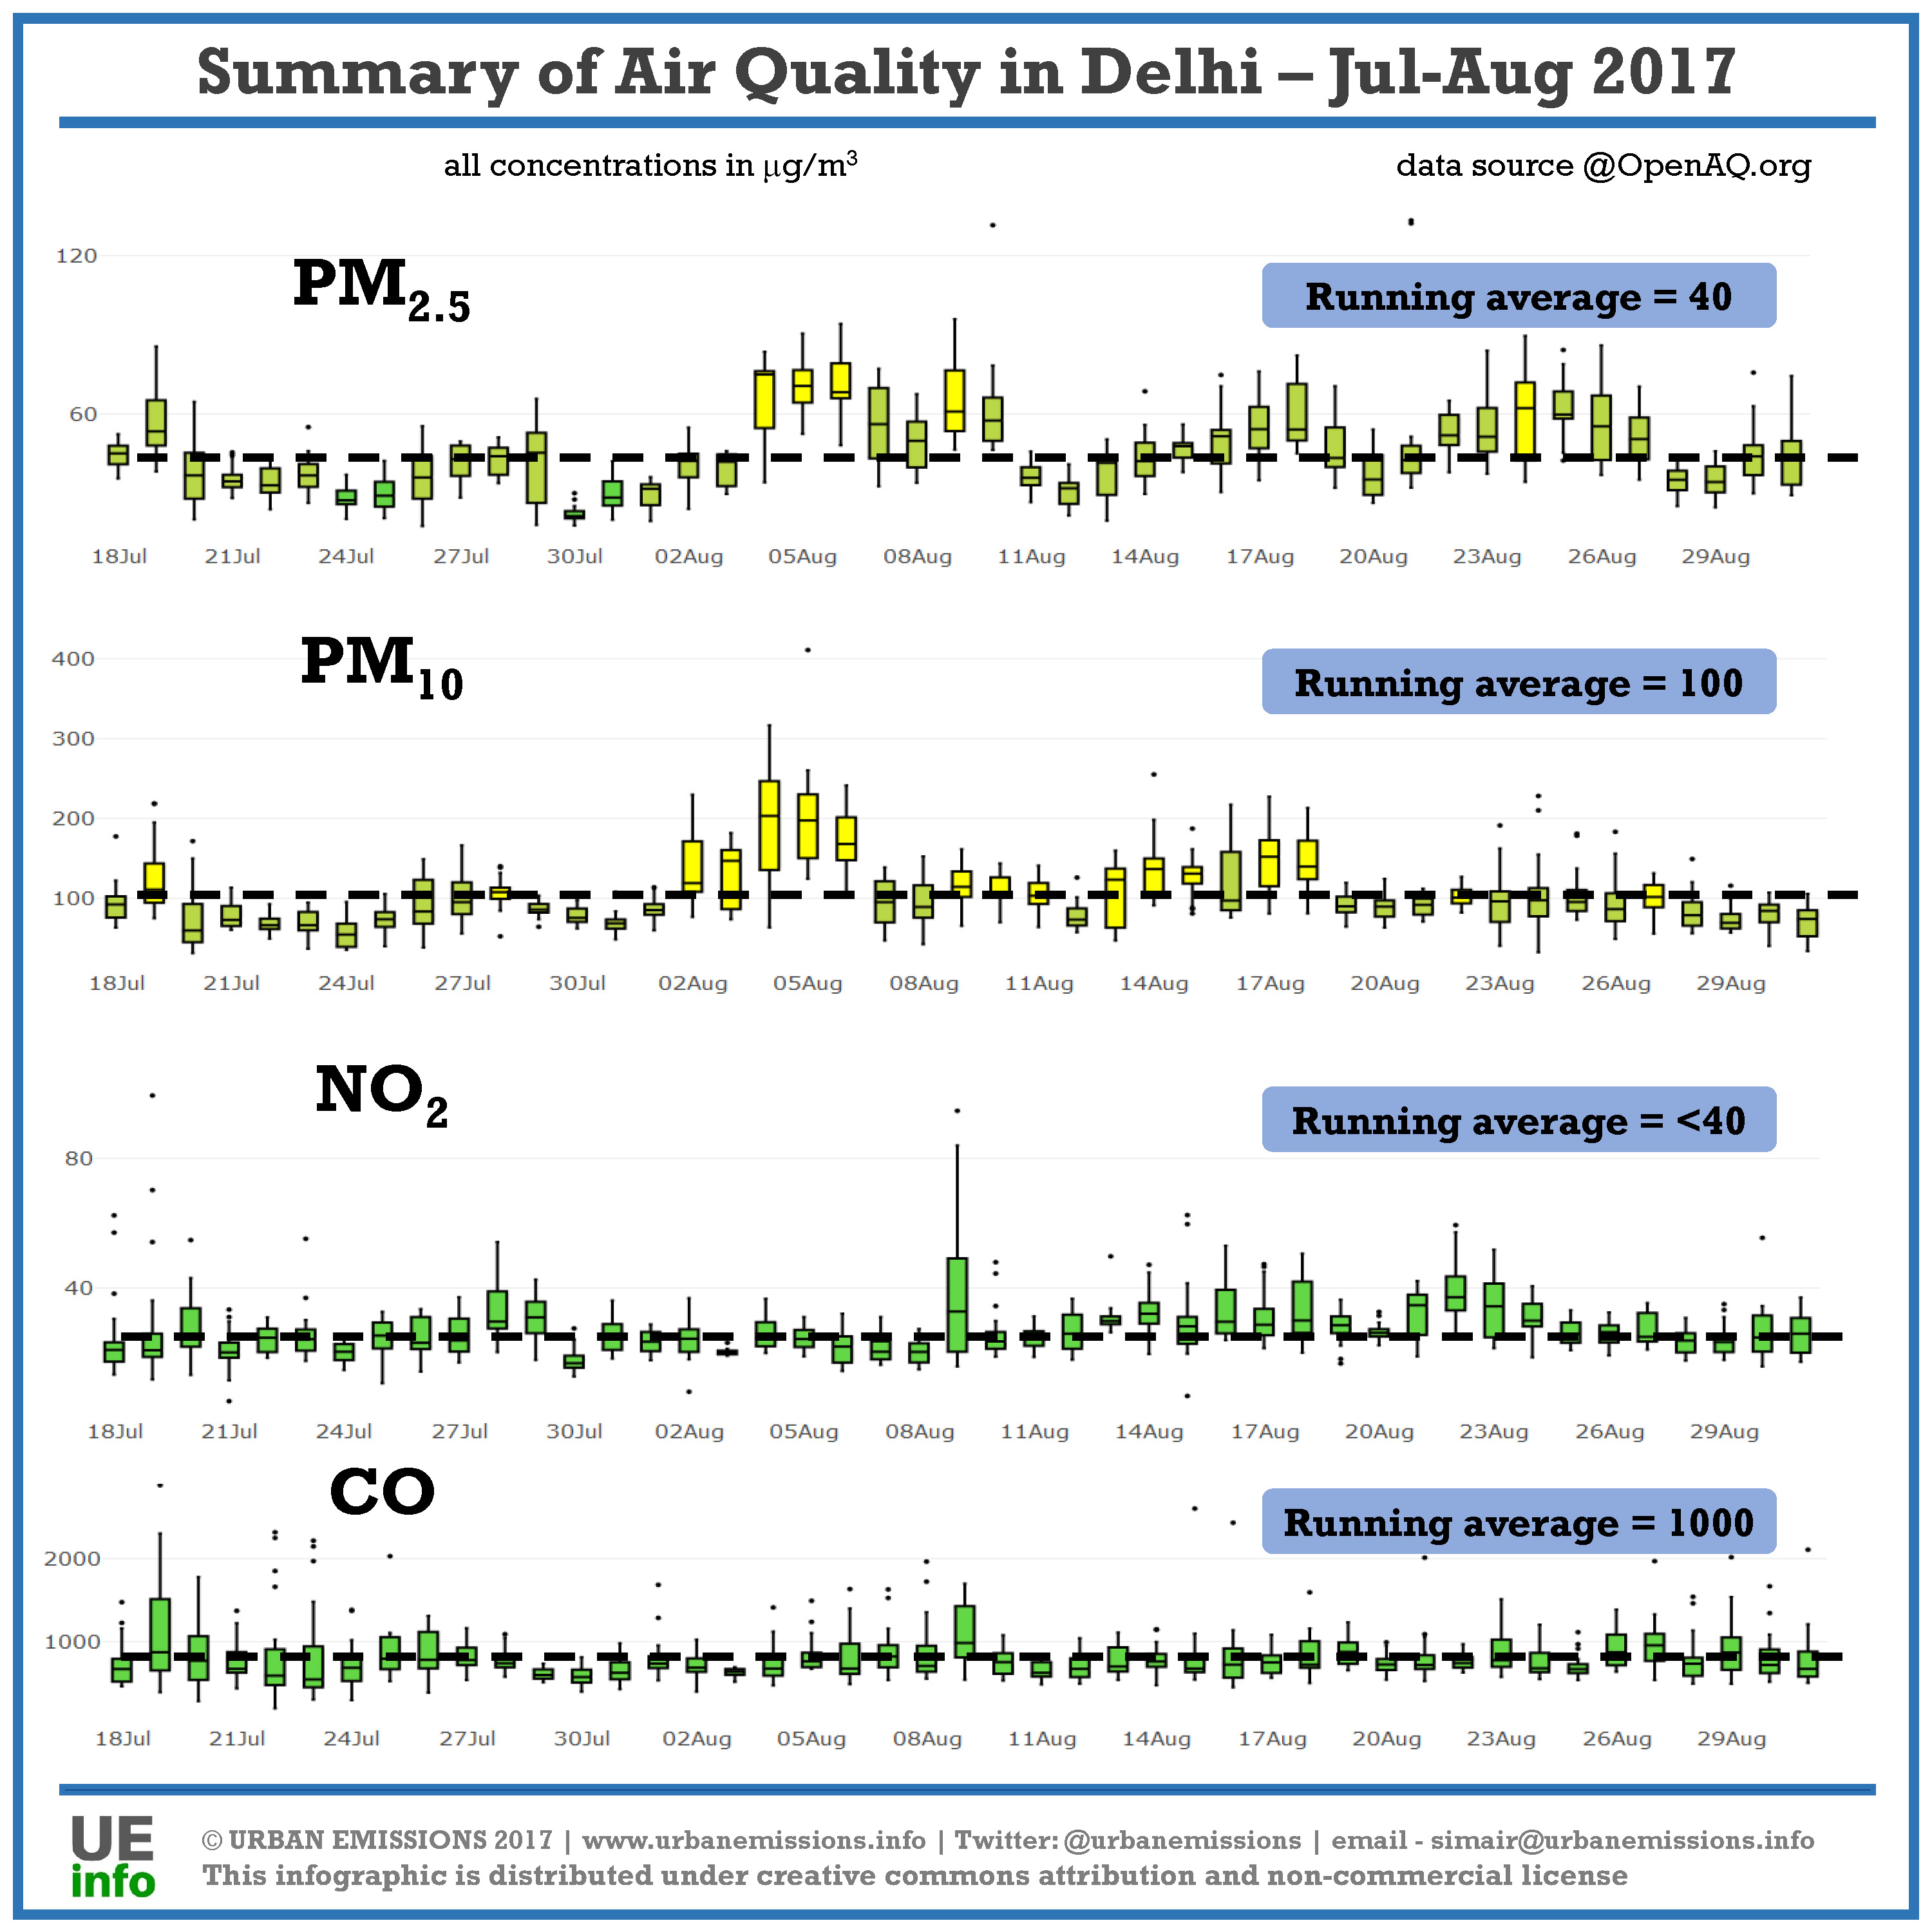
- Summary of PM2.5, PM10, NO2, and CO concentrations in Delhi for months of July and August 2017 (download)
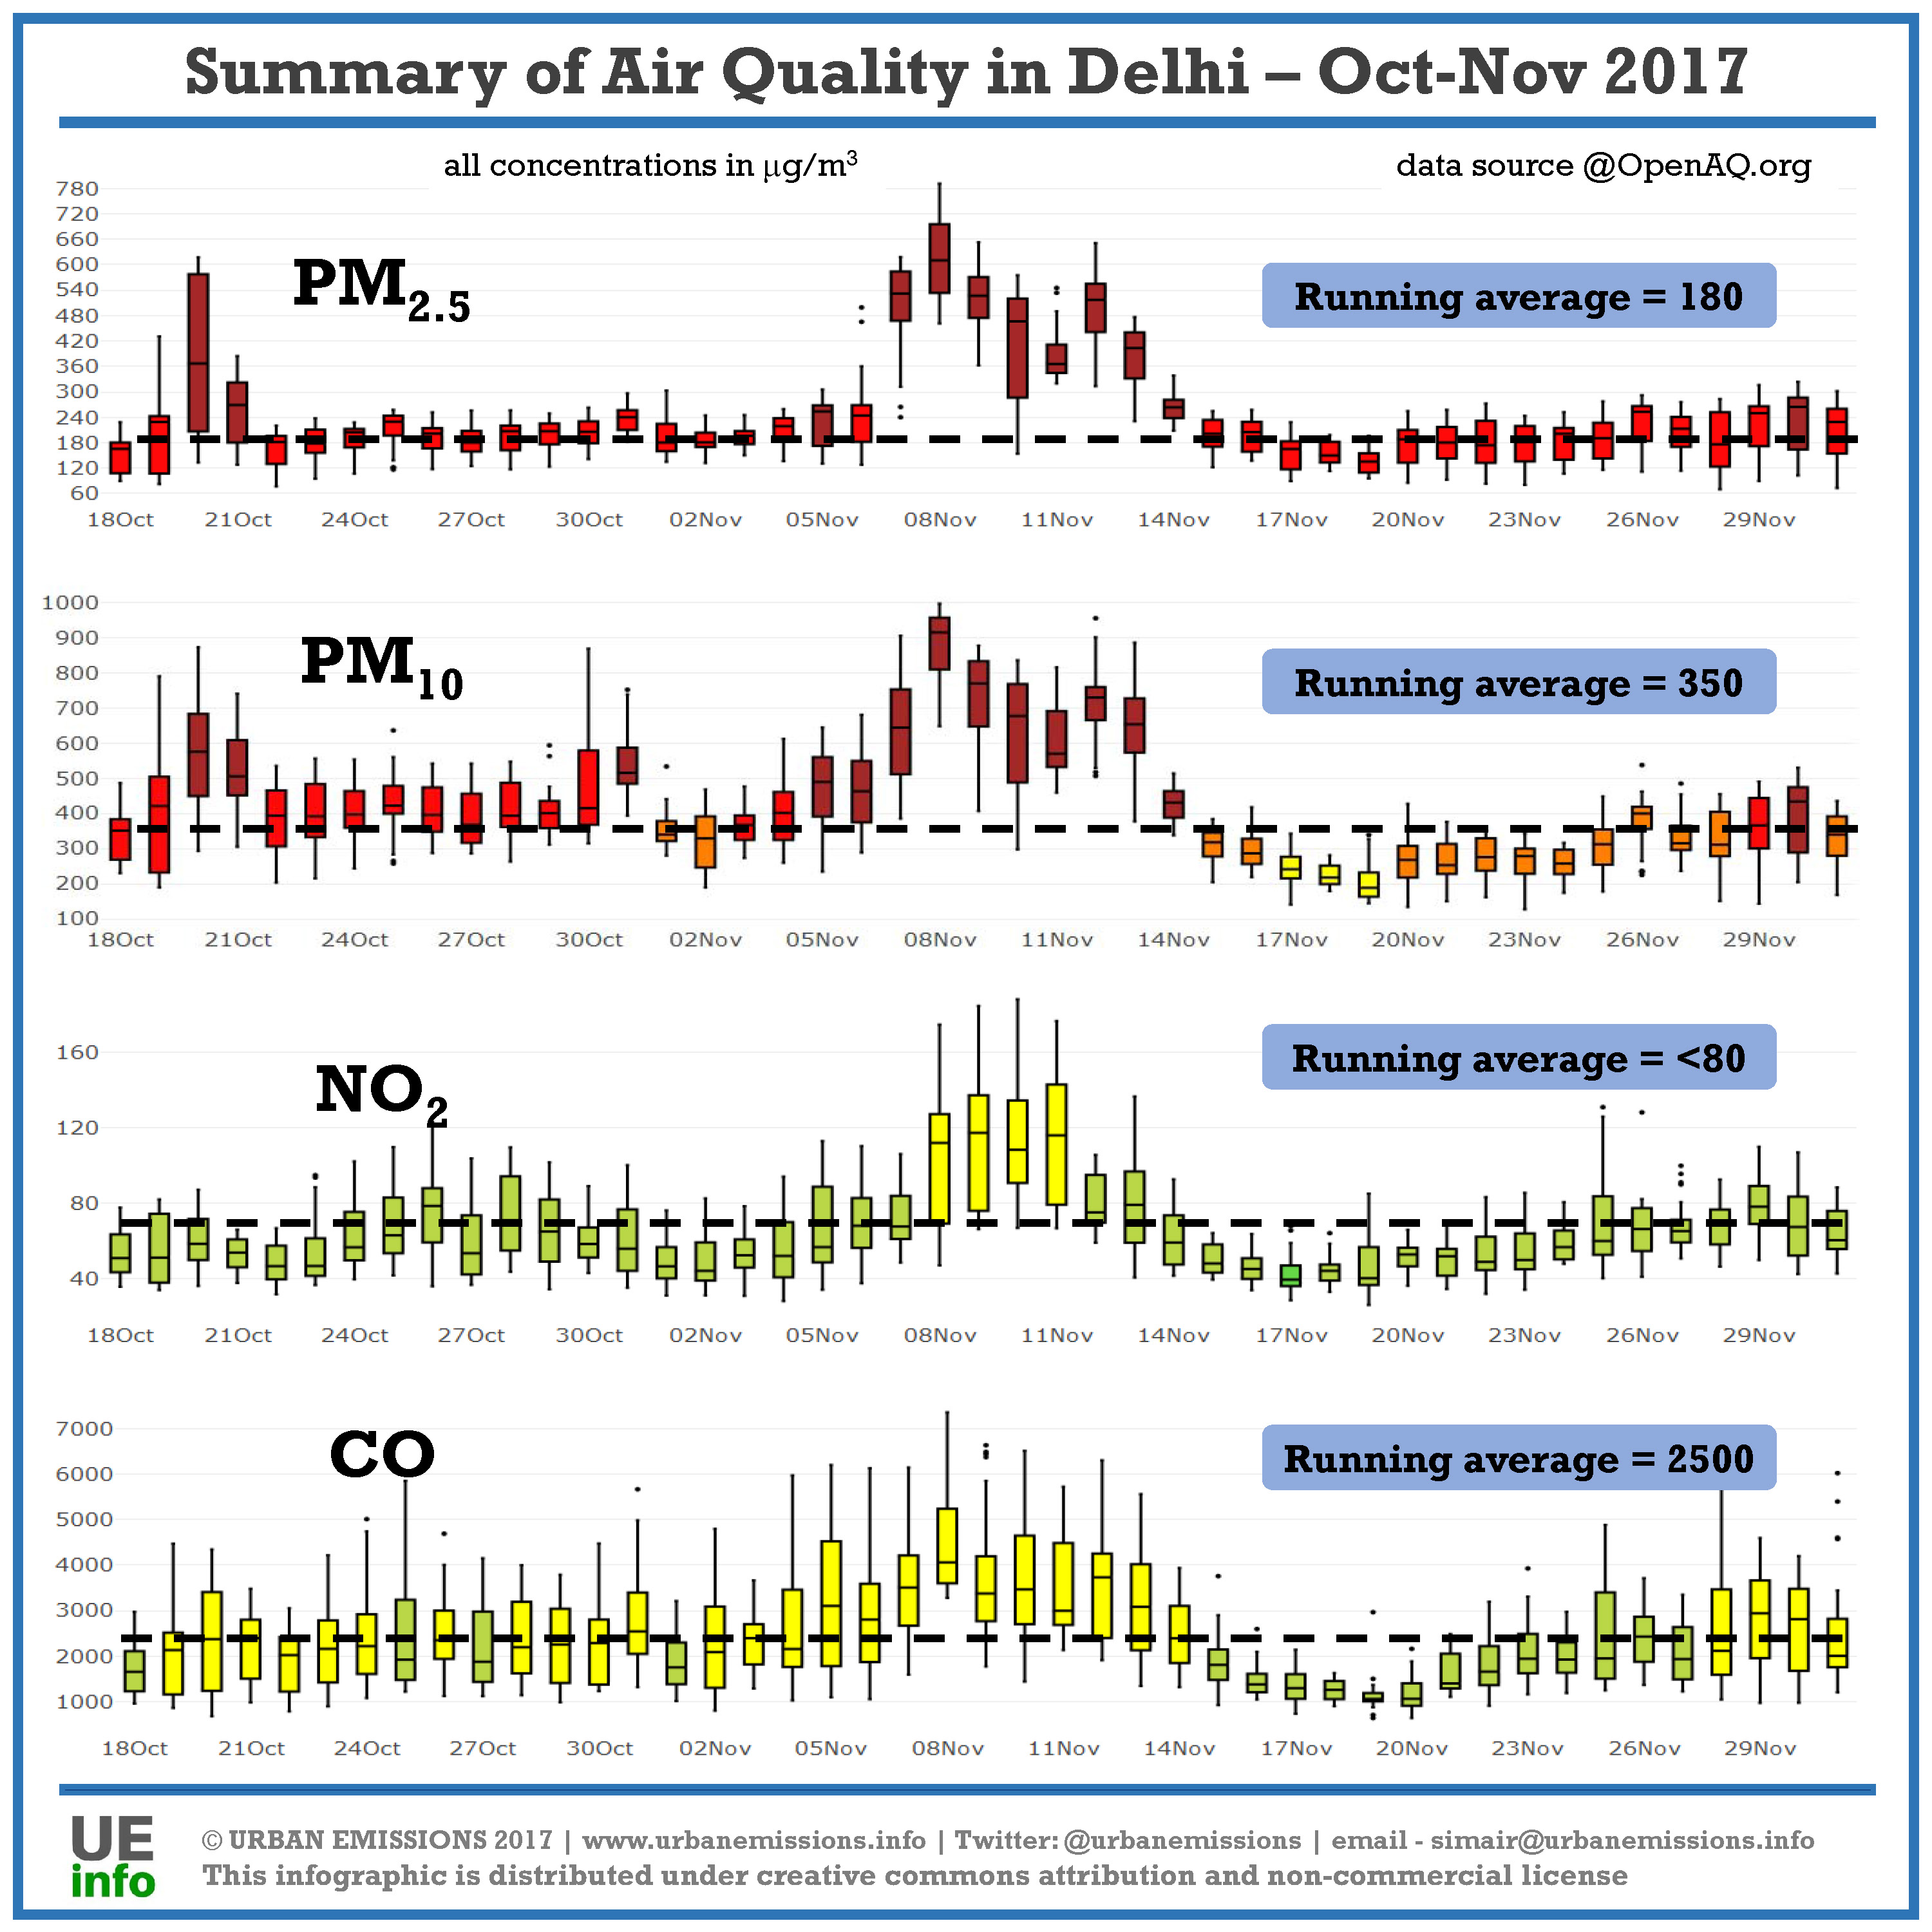
- Summary of PM2.5, PM10, NO2, and CO concentrations in Delhi for the months of October and November 2017 (download)
- Understanding road transport emissions in Delhi (vehicle numbers, usages, and emissions) between 1990 and 2015 (download)

- Infographics on India’s air quality
- Number of open biomass fires detected in the VIIRS satellite feeds in India by state and by month from 2012 to 2019 (download)
- Open fires detected in the VIIRS satellite feeds over the Indian Subcontinent by month from 2012 to 2019 (download)
- Open fires detected in the VIIRS satellite feeds over the Indian Subcontinent by day in 2018 (download)
- Tomorrow’s air quality information today – Poster on India’s air quality forecasting system (download)
- Clearing the air with data – Poster on India’s air pollution knowledge assessments (APnA) city program (download)
- Air quality forecasts for 50 Indian cities as air quality index for the next 3 days (download)
- Comparison of number of continuous air monitoring stations operational in India and China, as of October 2018 (download)
- Number of continuous monitoring stations operational in India by state, as of December 2017 (download)
- Number of manual and continuous monitoring stations operational and recommended minimum number of stations in India by state, as of November 2018 (download)
- Number of continuous monitoring stations operational in India by state, as of September 2017 (download)
- Reanalyzed PM2.5 concentrations over India in 1998, 2014, and 2015 and compliance levels by districts (download)
- Summary of wind directions over some Indian cities in 2015 (download)
- Infographics on air quality in Indian cities, other than Delhi
- Comparison of weekday and weekend traffic by hour in Hyderabad, Ahmedabad, Kota, and Agartala (download)
- Modeled monthly source contributions to PM2.5 concentrations in Hyderabad (download)
- Modeled monthly average PM2.5 concentrations over Hyderabad airshed (download)
- Summary of measured PM2.5 concentrations in Bengaluru and monitoring needs (download)
- Summary of average meteorology in Bengaluru’s airshed from WRF simulations for year 2015 – wind speeds, wind directions, mixing heights, and surface air temperature (download)
- Modeled monthly source contributions to PM2.5 concentrations in Bengaluru (download)
- Modeled monthly average PM2.5 concentrations over Bengaluru airshed (download)
- Infographics on general air quality
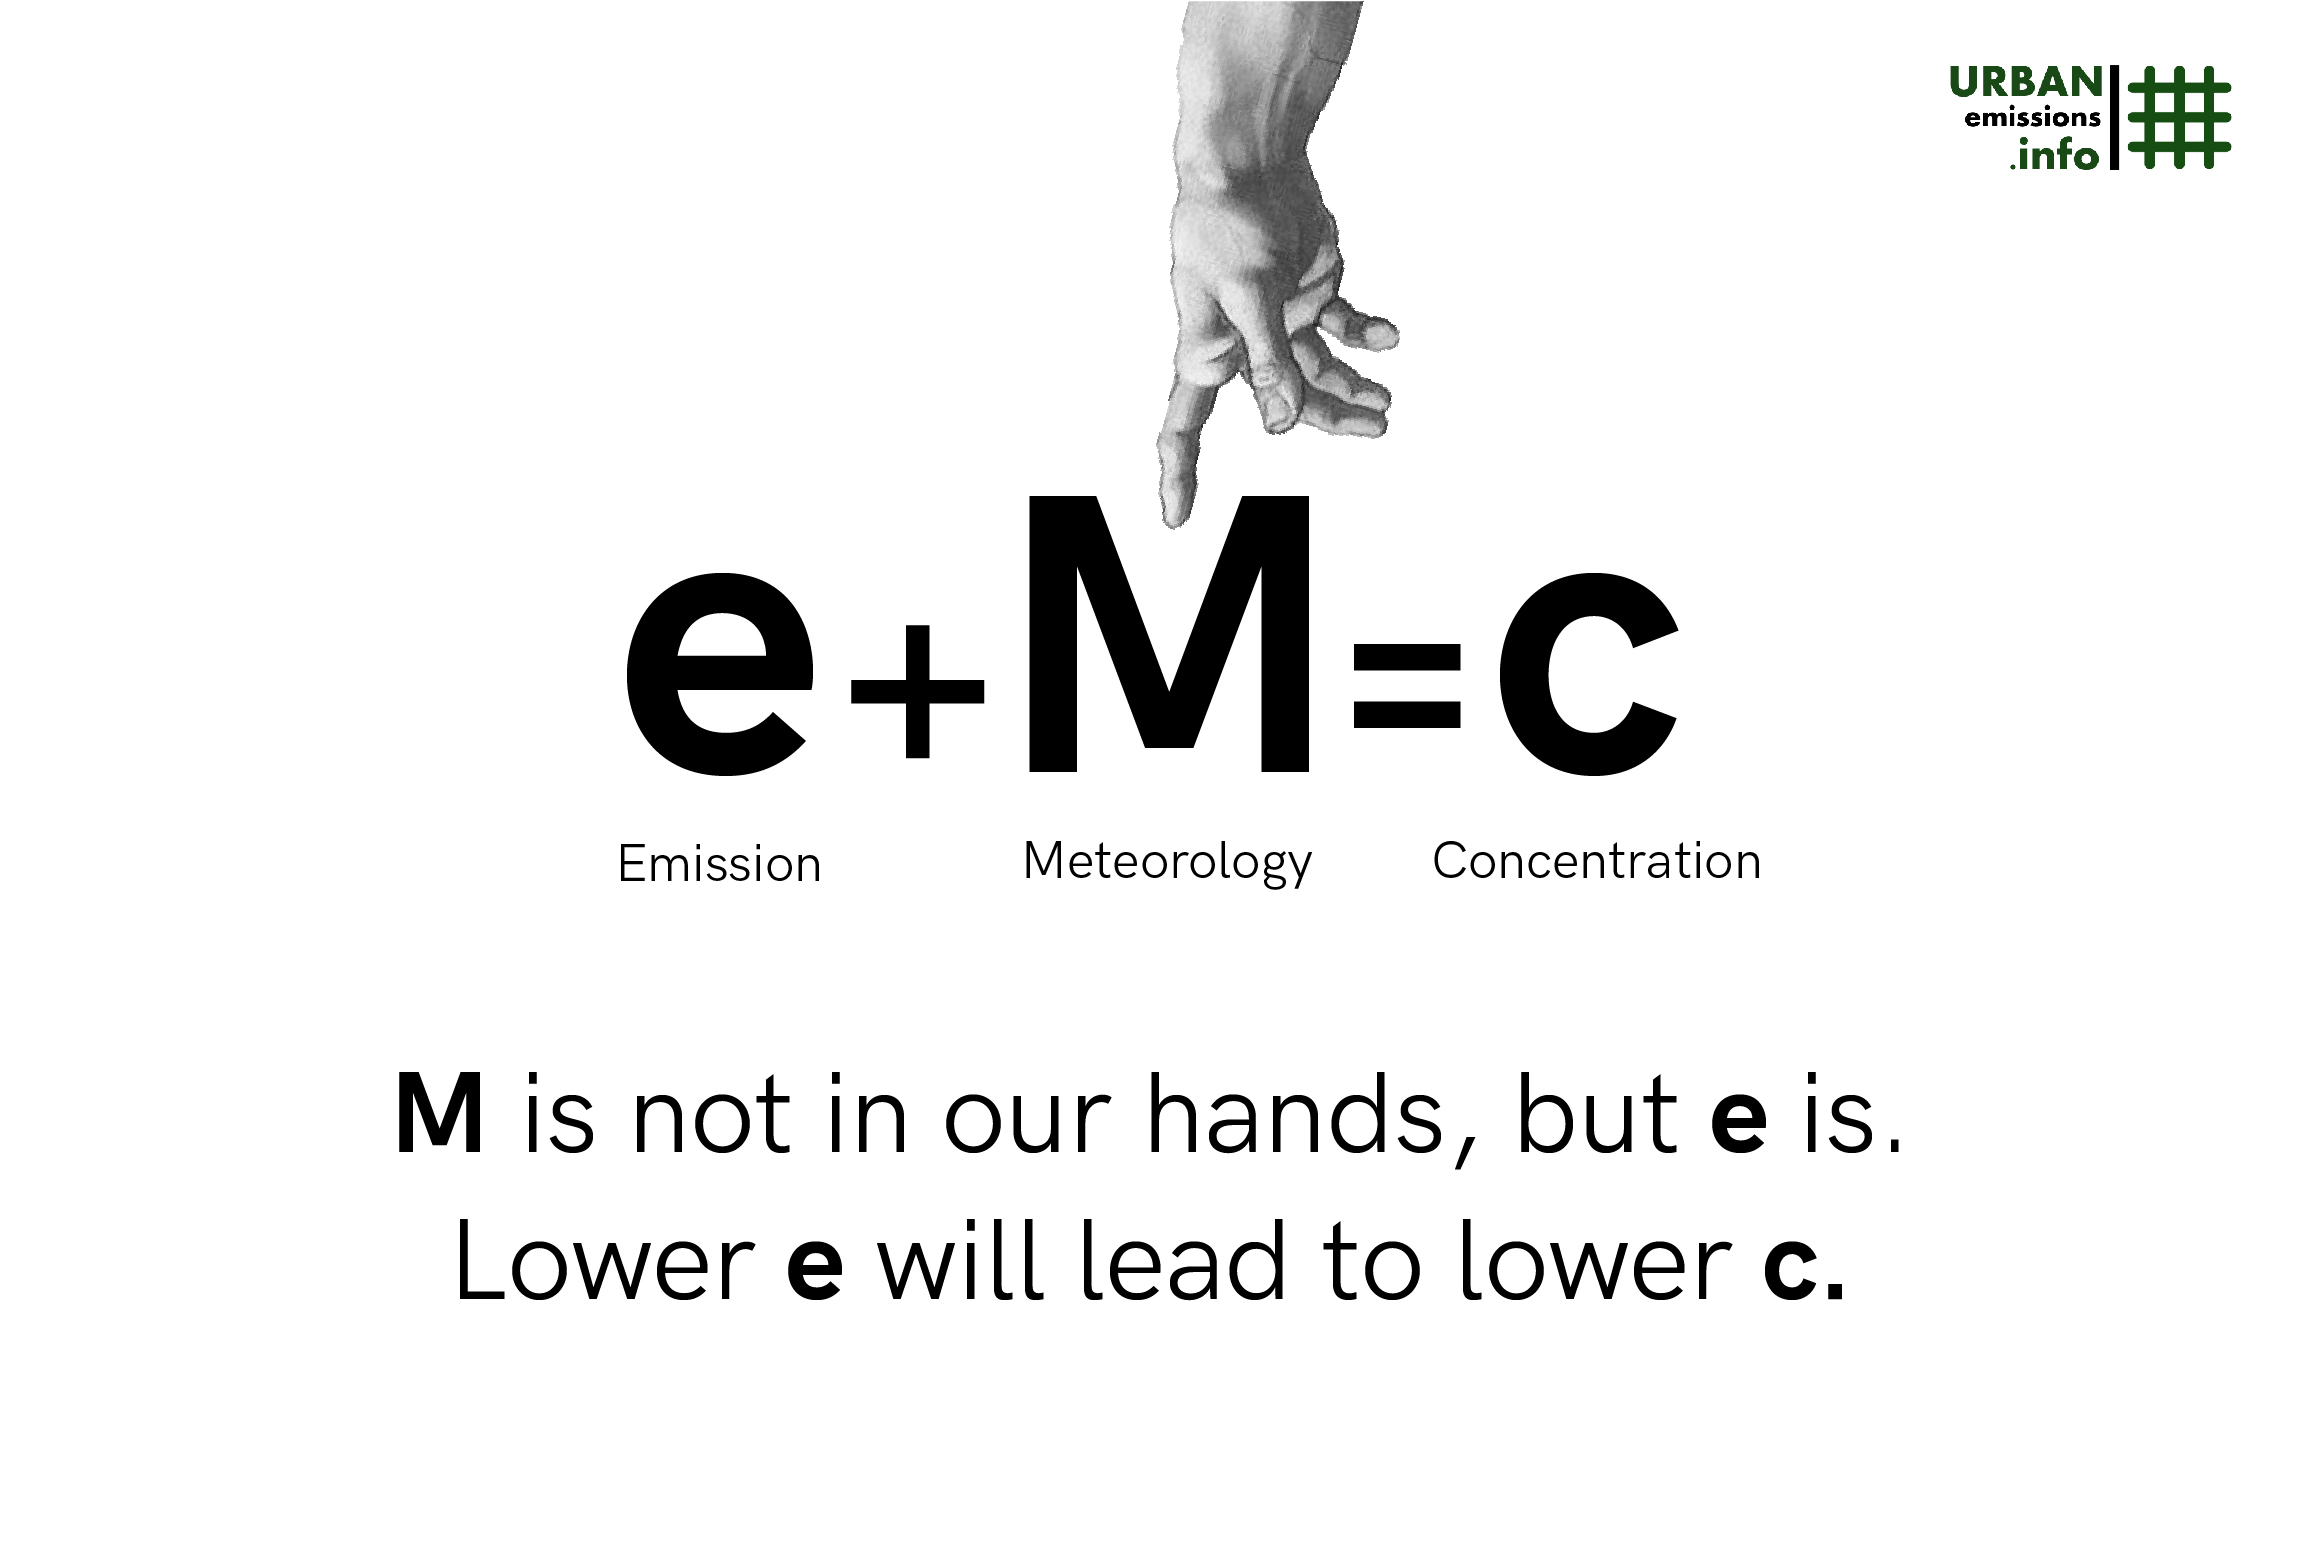
- E = mc2 (Emissions + Meteorology = Concentrations) (download)
- Three kinds of we need to manage air pollution – 1.Feeders (download)
- Three kinds of we need to manage air pollution – 2.Drummers (download)
- Three kinds of we need to manage air pollution – 3.Changers (download)
- World Lung Day 2019 – Air pollution is linked to… (download)
- Poster on simplified overview of tropospheric chemistry (download)
- Per-capita parking requirements for a motorcycle, car, bus, and a passenger train (download)
- What is the difference between air quality and air quality index (download)
- What is the difference between CEMS and CAAQMS (download)
- What is the difference between emissions and concentrations (download)
- Can I get emissions information from satellite feeds (download)
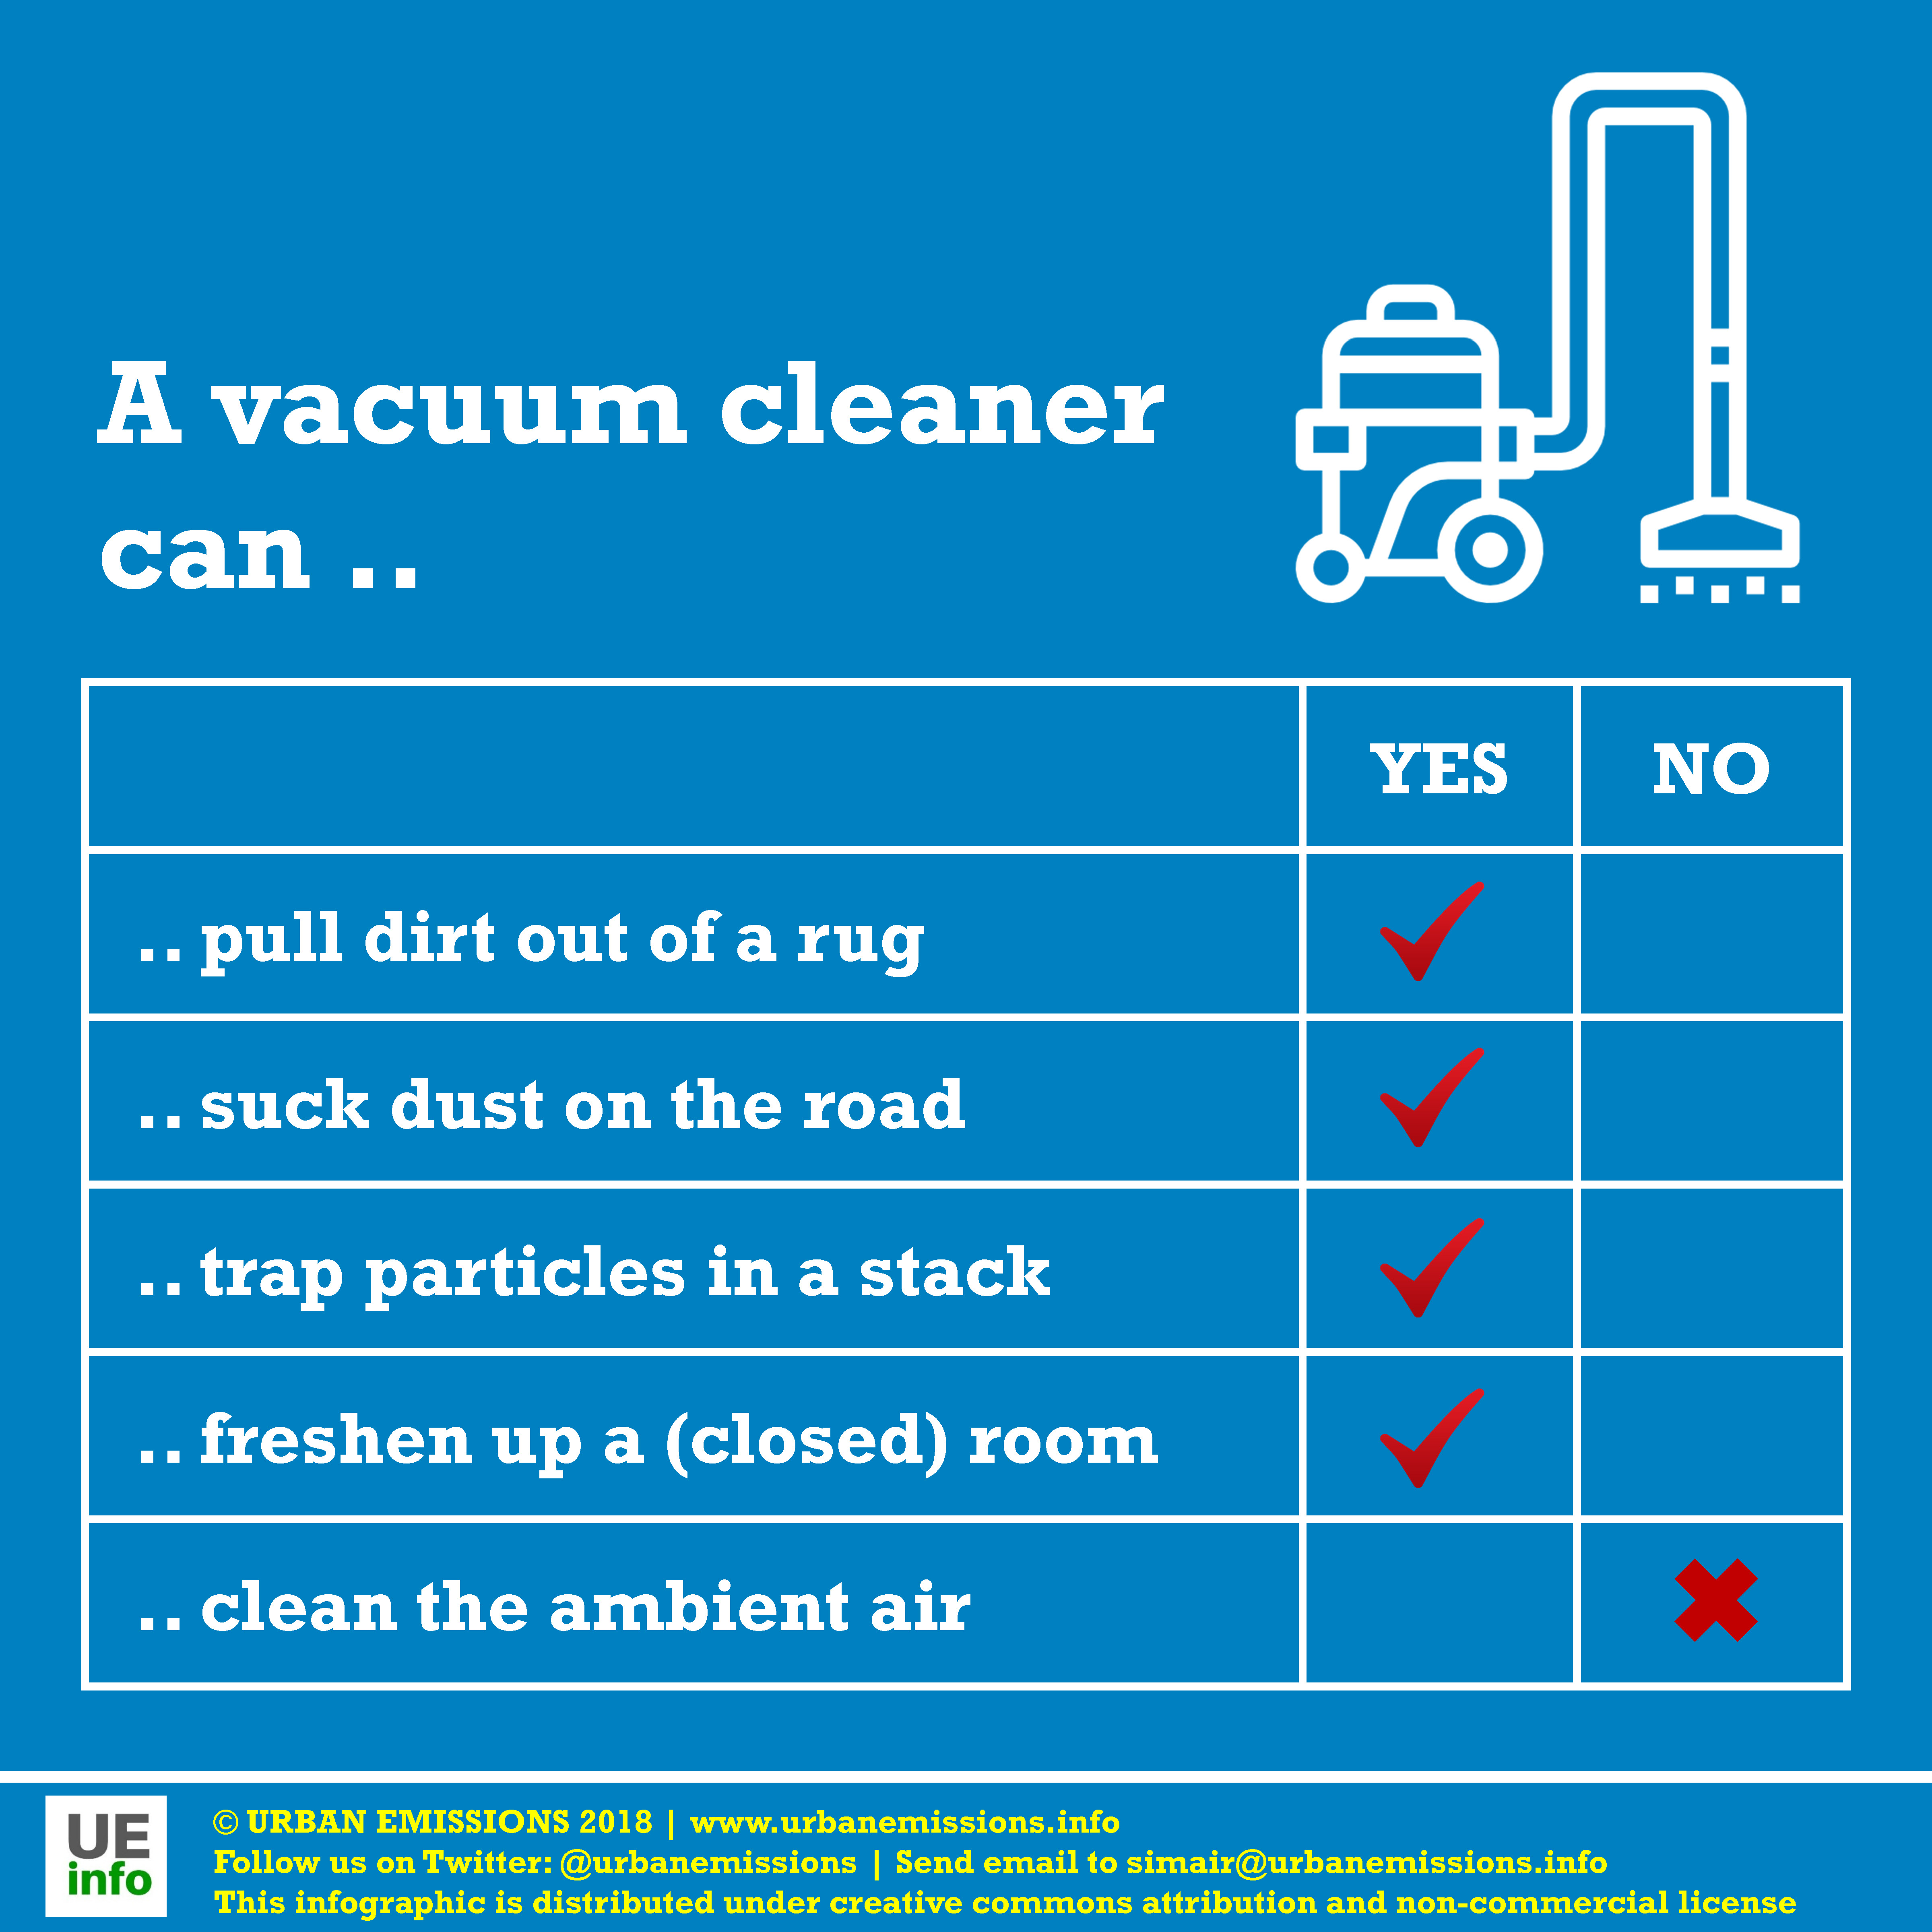
- Can we use a vacuum cleaner to suck up ambient air pollution (download)
- Can we use a vacuum cleaner to clean air pollution (box and dot visual) (download)
- Chemical composition of PM2.5 as metals and ions from various combustion sources (download)
- What are the sizes of particulate matter (download)
- Comparison of ambient air quality standards in India and WHO guidelines in 2016 (download)
- Comparison of manual and continuous monitoring methods in India (download)
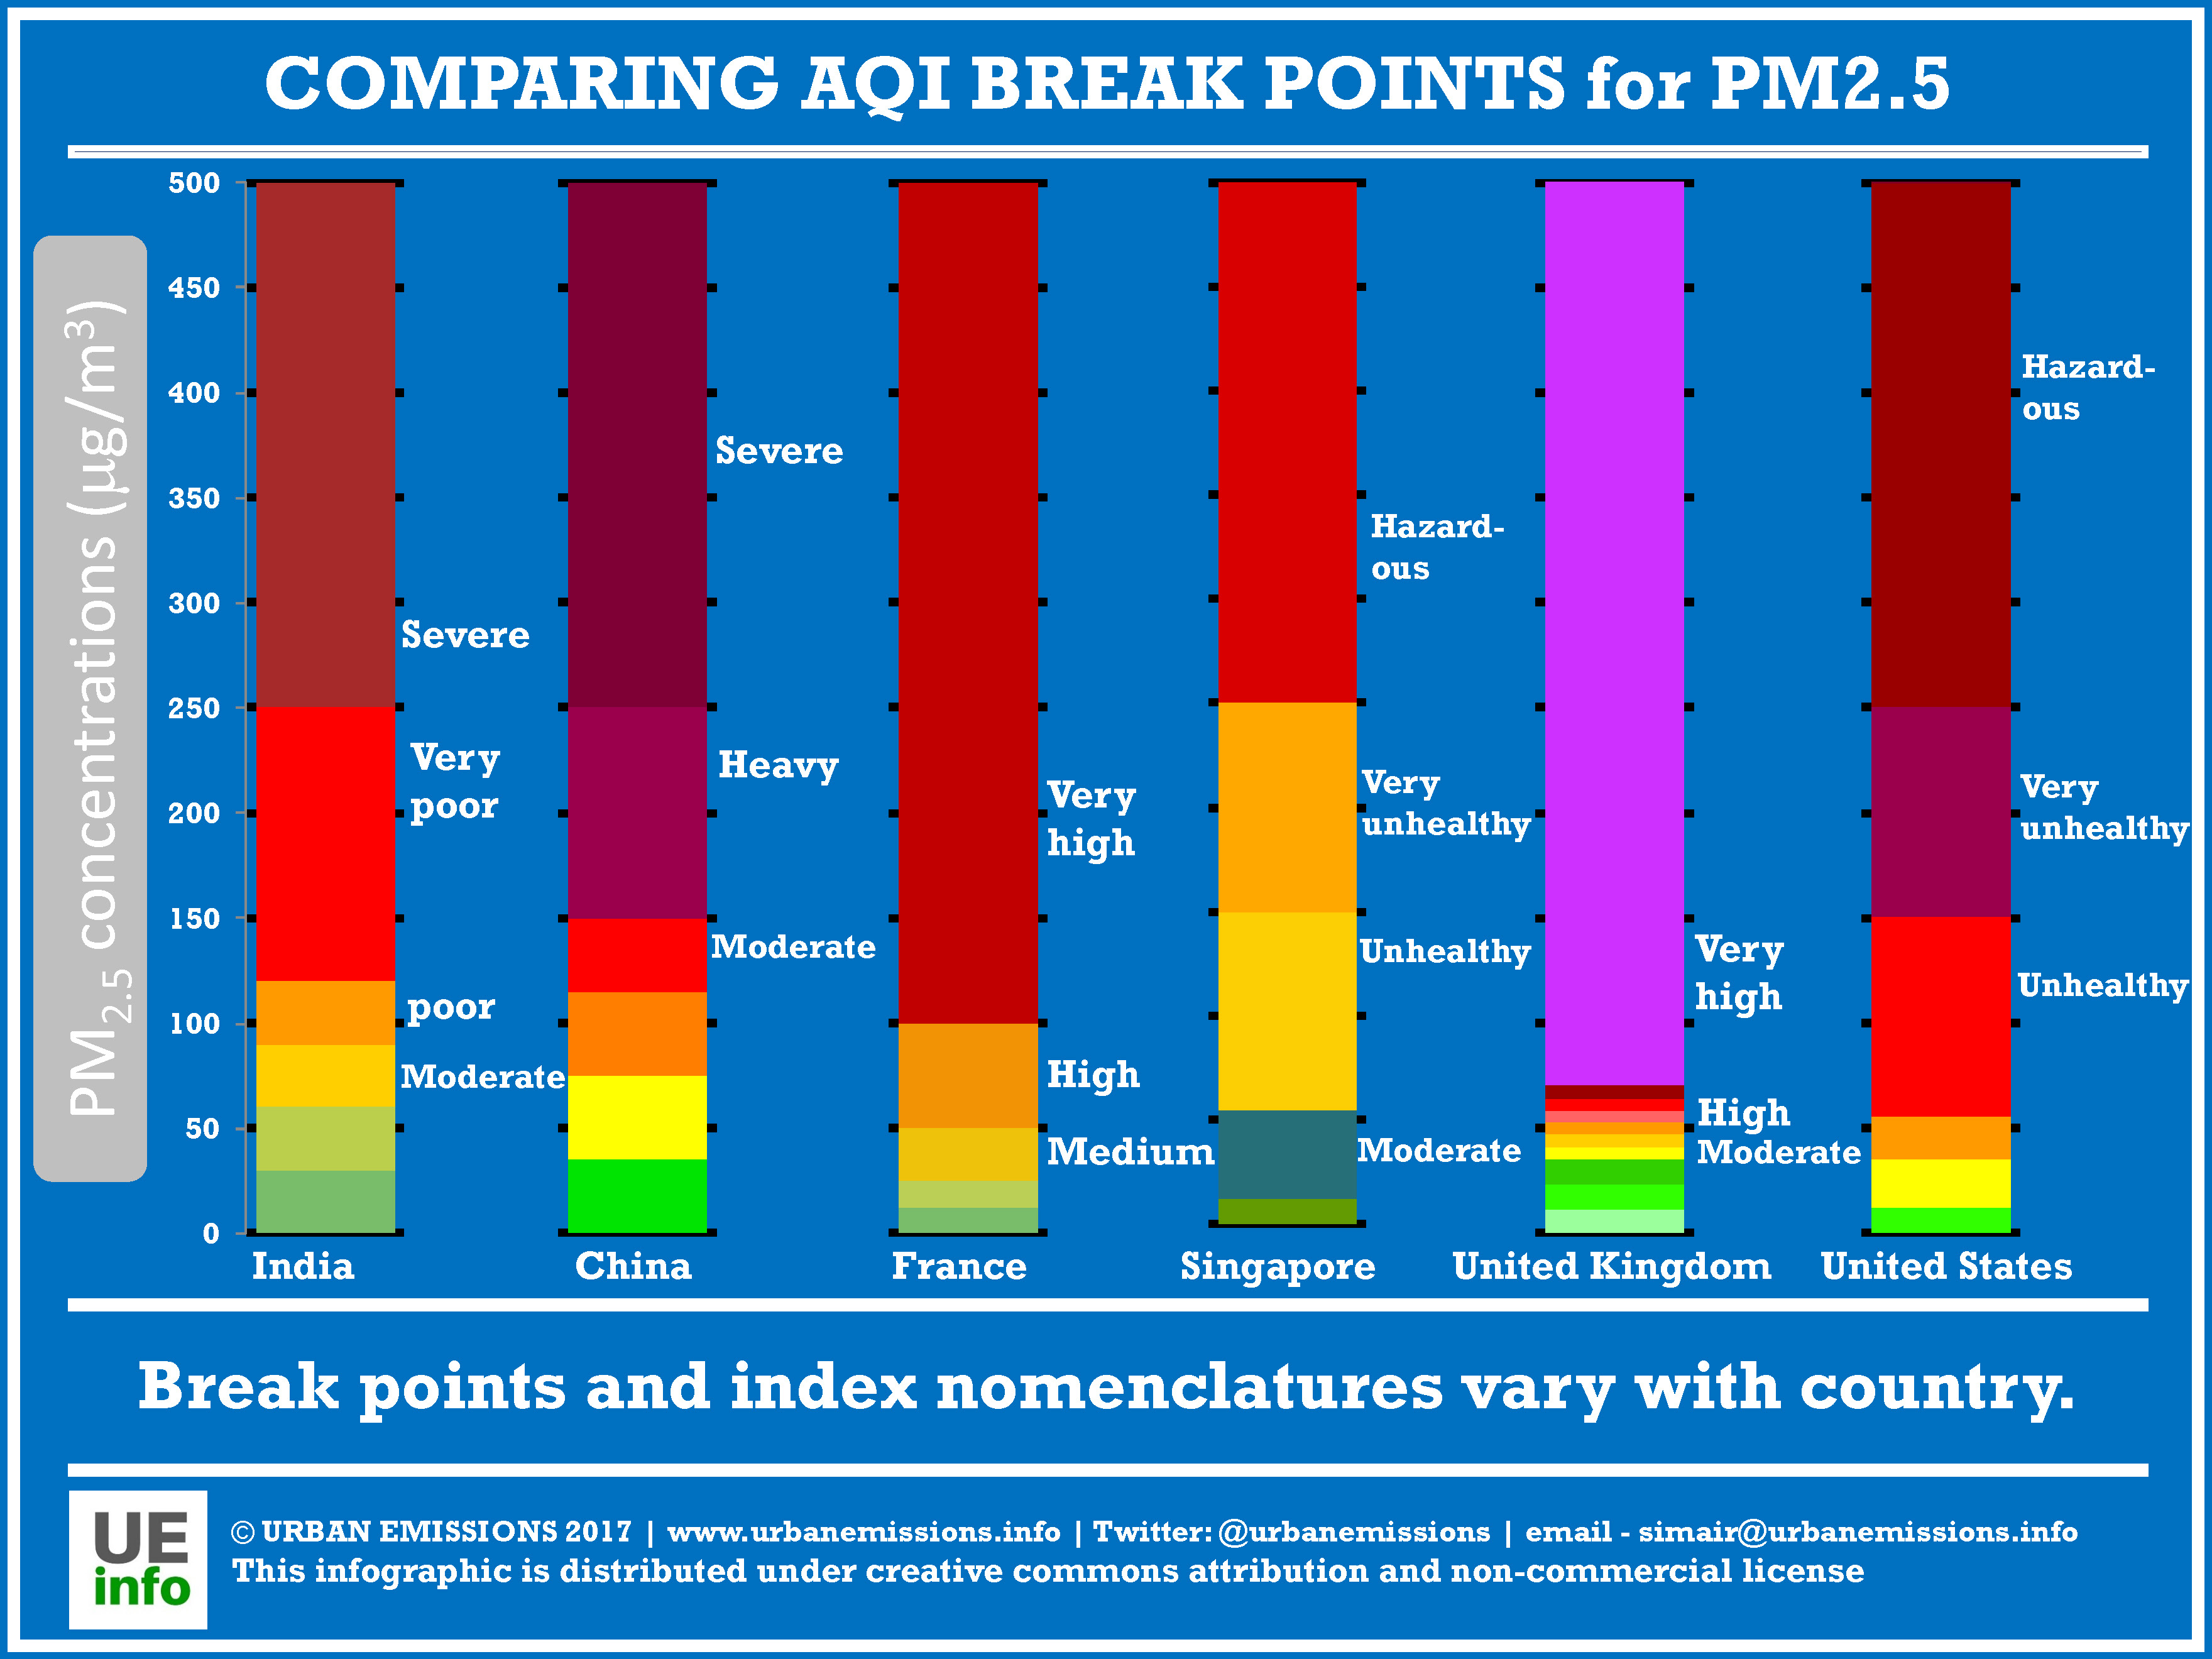
- Comparison of AQI break points for PM2.5 in India, China, France, Singapore, the United Kingdom, and the United States (download)
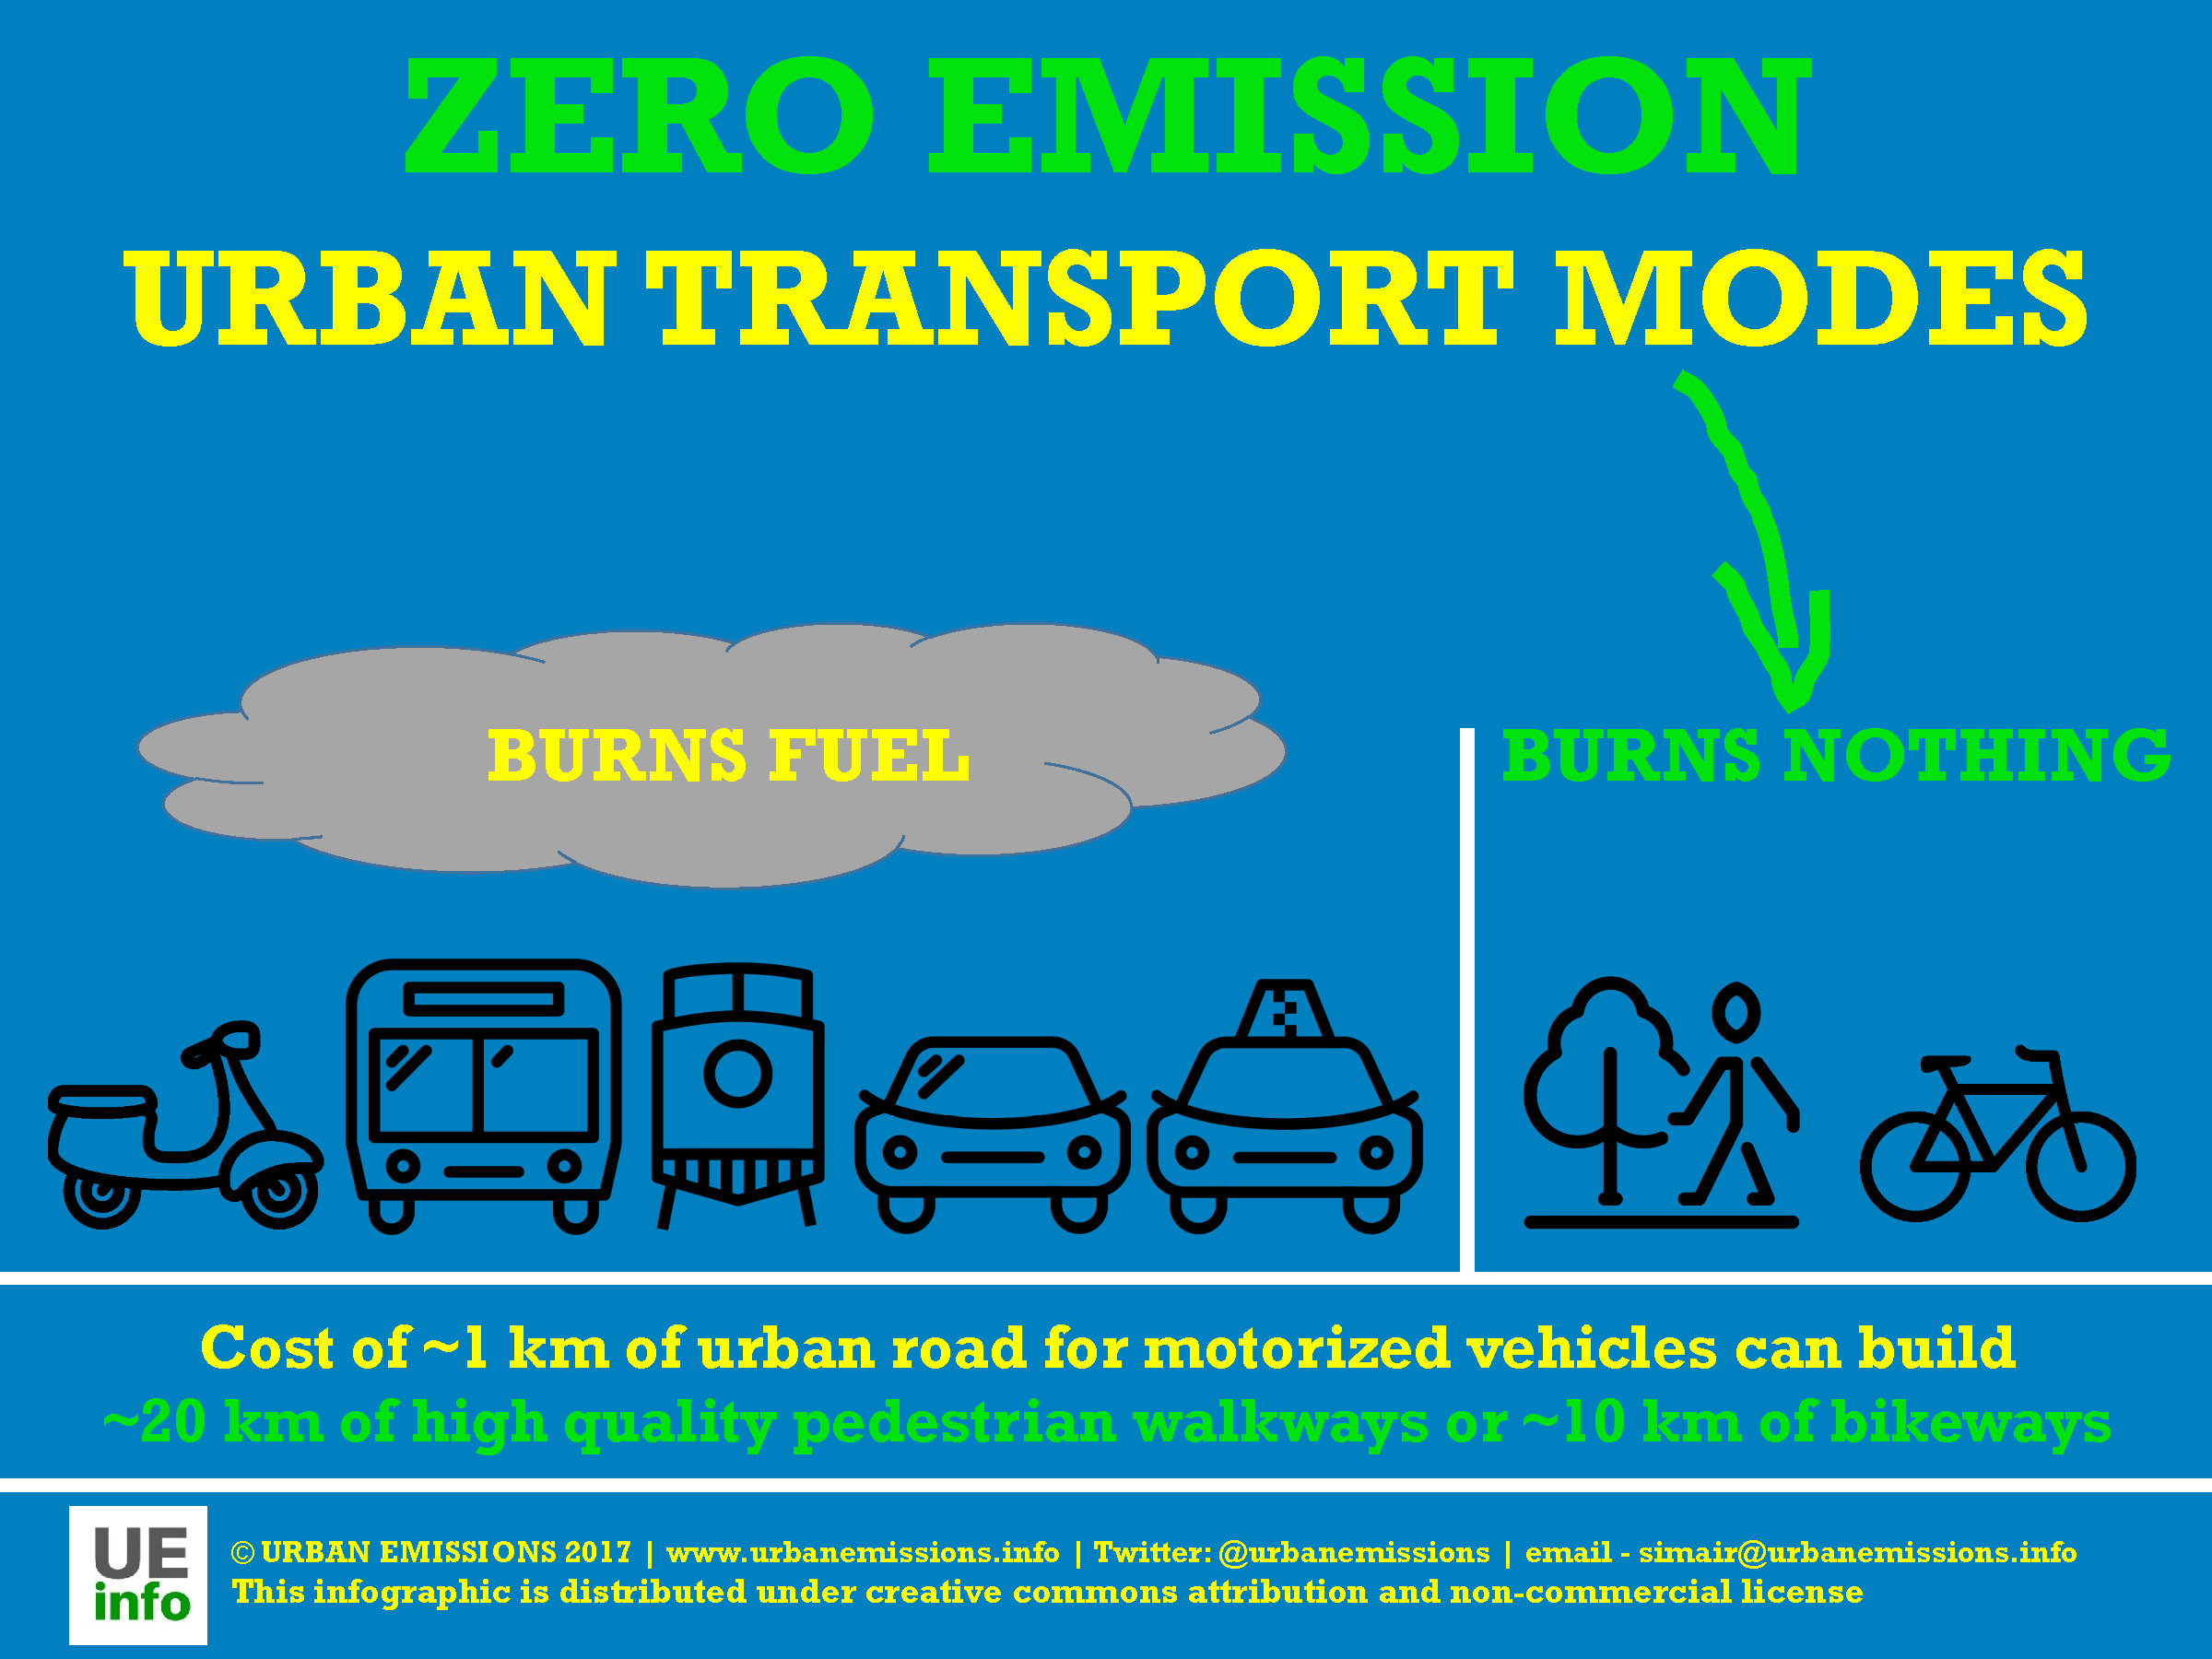
- What are the zero emission transport modes? (download)
- Infographics on pollution source apportionment
- What are the different fractions of particulate matter (PM)? (download)
- What is the difference between primary and secondary particulate matter (PM)? (download)
- What is the difference between fine and coarse particulate matter (PM)? (download)
- What is the difference between emissions and concentrations (download)
- Chemical composition of PM2.5 as metals and ions from various combustion sources (download)
- What is the difference between top-down and bottom-up source apportionment methods (download)
- What are the top-down source apportionment steps (download)
- What are the bottom-up source apportionment steps (download)
